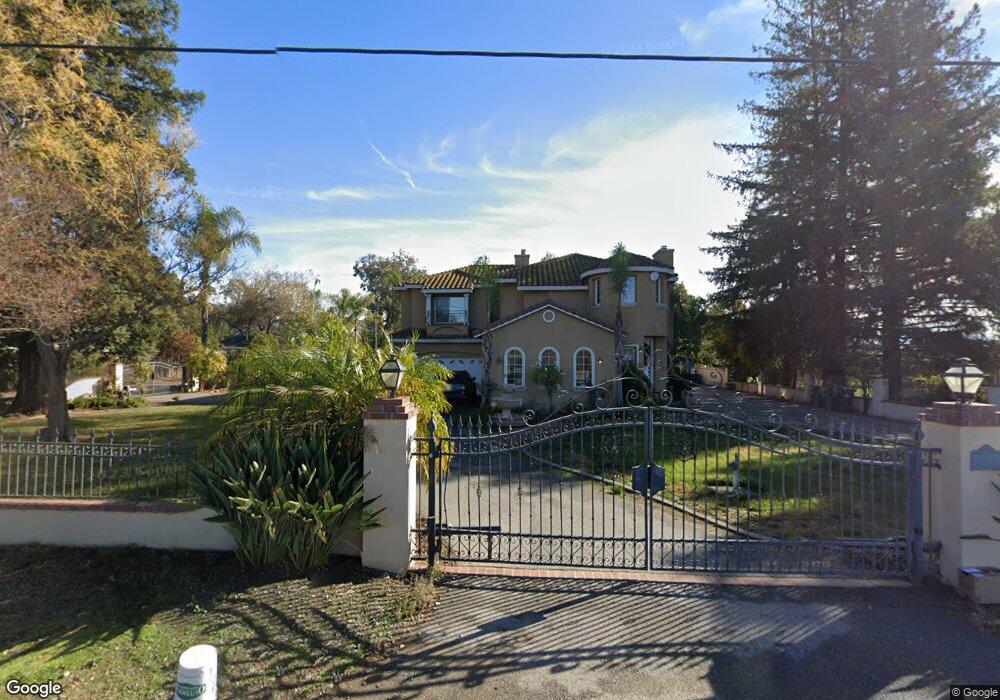
3300 Leavesley Rd Gilroy, CA 95020
Estimated Value: $1,637,000 - $2,048,000
4
Beds
4
Baths
3,536
Sq Ft
$535/Sq Ft
Est. Value
About This Home
This home is located at 3300 Leavesley Rd, Gilroy, CA 95020 and is currently estimated at $1,890,993, approximately $534 per square foot. 3300 Leavesley Rd is a home located in Santa Clara County with nearby schools including Rucker Elementary School, Solorsano Middle School, and Christopher High School.
Ownership History
Date
Name
Owned For
Owner Type
Purchase Details
Closed on
Dec 28, 2006
Sold by
Garcia Efrain D
Bought by
Garcia Efrain D
Current Estimated Value
Home Financials for this Owner
Home Financials are based on the most recent Mortgage that was taken out on this home.
Original Mortgage
$910,000
Outstanding Balance
$545,023
Interest Rate
6.25%
Mortgage Type
Stand Alone Refi Refinance Of Original Loan
Estimated Equity
$1,345,970
Purchase Details
Closed on
Apr 17, 2002
Sold by
Alvarado Alicia Ramirez
Bought by
Garcia Efrain D
Home Financials for this Owner
Home Financials are based on the most recent Mortgage that was taken out on this home.
Original Mortgage
$600,000
Interest Rate
6.75%
Mortgage Type
Negative Amortization
Purchase Details
Closed on
Aug 21, 2000
Sold by
Mckenzie Thomas M and Mckenzie Lillian S
Bought by
Managed Investments Inc
Create a Home Valuation Report for This Property
The Home Valuation Report is an in-depth analysis detailing your home's value as well as a comparison with similar homes in the area
Purchase History
| Date | Buyer | Sale Price | Title Company |
|---|---|---|---|
| Garcia Efrain D | -- | Commonwealth Land Title | |
| Garcia Efrain D | -- | Financial Title Company | |
| Garcia Efrain D | $875,000 | Financial Title Company | |
| Managed Investments Inc | $285,000 | Landsafe Title |
Source: Public Records
Mortgage History
| Date | Status | Borrower | Loan Amount |
|---|---|---|---|
| Open | Garcia Efrain D | $910,000 | |
| Closed | Garcia Efrain D | $600,000 |
Source: Public Records
Tax History
| Year | Tax Paid | Tax Assessment Tax Assessment Total Assessment is a certain percentage of the fair market value that is determined by local assessors to be the total taxable value of land and additions on the property. | Land | Improvement |
|---|---|---|---|---|
| 2025 | $16,209 | $1,351,865 | $480,114 | $871,751 |
| 2024 | $16,209 | $1,325,358 | $470,700 | $854,658 |
| 2023 | $16,092 | $1,299,371 | $461,471 | $837,900 |
| 2022 | $15,806 | $1,273,894 | $452,423 | $821,471 |
| 2021 | $15,737 | $1,248,916 | $443,552 | $805,364 |
| 2020 | $15,547 | $1,236,110 | $439,004 | $797,106 |
| 2019 | $15,393 | $1,211,874 | $430,397 | $781,477 |
| 2018 | $14,298 | $1,188,112 | $421,958 | $766,154 |
| 2017 | $14,605 | $1,164,817 | $413,685 | $751,132 |
| 2016 | $14,311 | $1,141,978 | $405,574 | $736,404 |
| 2015 | $13,466 | $1,124,825 | $399,482 | $725,343 |
| 2014 | $13,309 | $1,102,792 | $391,657 | $711,135 |
Source: Public Records
Map
Nearby Homes
- 0 Crews Rd
- 2800 Dryden Ave
- 3970 Leavesley Rd
- 2718 Ferguson Rd
- 8875 New Ave
- 2712 Ferguson Rd
- 3455 Susie Ln
- 2675 Pacheco Pass Hwy
- 2025 Pacheco Pass Hwy
- 2035 Pacheco Pass Hwy
- 2160 Pacheco Pass Hwy
- 1930 Pacheco Pass Hwy
- 700 Las Animas Ave
- 0 New Ave
- 8282 Murray Ave Unit 99
- 8282 Murray Ave Unit 65
- 730 Lepa Ct
- 0 Pacheco Pass Hwy
- 0 Magic Springs Dr Unit ML82028522
- 0 Dorrance Rd Unit ML82002071
- 3260 Leavesley Rd Unit C
- 3260 Leavesley Rd
- 3330 Leavesley Rd
- 3306 Leavesley Rd
- 3326 Leavesley Rd
- 3350 Leavesley Rd
- 3310 Leavesley Rd
- 3322 Leavesley Rd
- 3440 Leavesley Rd
- 3295 Leavesley Rd
- 3314 Leavesley Rd
- 3120 Leavesley Rd
- 3115 Leavesley Rd
- 7845 Cullen Ln
- 3305 Godfrey Ave
- 3090 Dryden Ave
- 7835 Cullen Ln
- 3535 Godfrey Ave
- 3030 Leavesley Rd
- 3525 Godfrey Ave
Your Personal Tour Guide
Ask me questions while you tour the home.