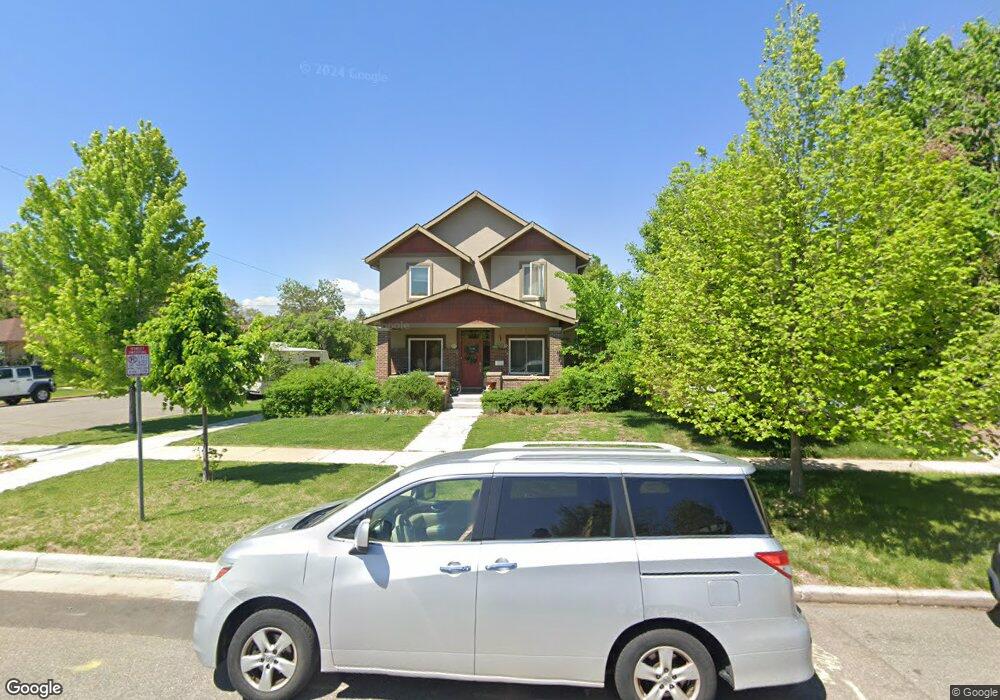
3301 N Vine St Denver, CO 80205
Cole NeighborhoodEstimated Value: $1,110,000 - $1,197,154
3
Beds
4
Baths
2,411
Sq Ft
$478/Sq Ft
Est. Value
About This Home
This home is located at 3301 N Vine St, Denver, CO 80205 and is currently estimated at $1,152,039, approximately $477 per square foot. 3301 N Vine St is a home with nearby schools including Columbine Elementary School, Whittier ECE-8 School, and McAuliffe Manual Middle School.
Ownership History
Date
Name
Owned For
Owner Type
Purchase Details
Closed on
Jan 1, 2021
Sold by
Paschall Amanda J
Bought by
Cook Madison Glencoe Llc
Current Estimated Value
Purchase Details
Closed on
Dec 18, 2015
Sold by
Paschall Donavon and Paschall Amanda
Bought by
Paschall Amanda J
Purchase Details
Closed on
May 31, 2011
Sold by
Elevated Properties Inc
Bought by
Paschall Donavon and Paschall Amanda
Purchase Details
Closed on
Mar 31, 1999
Sold by
Martinez Ivy M
Bought by
Lucero Bradley R
Purchase Details
Closed on
Jun 19, 1997
Sold by
Lucero Bradley R
Bought by
Martinez Ivy M
Home Financials for this Owner
Home Financials are based on the most recent Mortgage that was taken out on this home.
Original Mortgage
$12,000
Interest Rate
10%
Purchase Details
Closed on
Jun 18, 1997
Sold by
Center Investments
Bought by
Lucero Bradley R
Home Financials for this Owner
Home Financials are based on the most recent Mortgage that was taken out on this home.
Original Mortgage
$12,000
Interest Rate
10%
Create a Home Valuation Report for This Property
The Home Valuation Report is an in-depth analysis detailing your home's value as well as a comparison with similar homes in the area
Home Values in the Area
Average Home Value in this Area
Purchase History
| Date | Buyer | Sale Price | Title Company |
|---|---|---|---|
| Cook Madison Glencoe Llc | -- | None Available | |
| Paschall Amanda J | -- | Heritage Title Co | |
| Paschall Donavon | $82,000 | Heritage Title | |
| Lucero Bradley R | -- | -- | |
| Martinez Ivy M | $12,000 | -- | |
| Lucero Bradley R | $11,000 | -- |
Source: Public Records
Mortgage History
| Date | Status | Borrower | Loan Amount |
|---|---|---|---|
| Previous Owner | Martinez Ivy M | $12,000 |
Source: Public Records
Tax History Compared to Growth
Tax History
| Year | Tax Paid | Tax Assessment Tax Assessment Total Assessment is a certain percentage of the fair market value that is determined by local assessors to be the total taxable value of land and additions on the property. | Land | Improvement |
|---|---|---|---|---|
| 2024 | $5,962 | $75,280 | $18,880 | $56,400 |
| 2023 | $5,833 | $75,280 | $18,880 | $56,400 |
| 2022 | $4,727 | $59,440 | $18,720 | $40,720 |
| 2021 | $4,563 | $61,150 | $19,260 | $41,890 |
| 2020 | $4,202 | $56,630 | $16,850 | $39,780 |
| 2019 | $4,084 | $56,630 | $16,850 | $39,780 |
| 2018 | $2,910 | $37,610 | $18,590 | $19,020 |
| 2017 | $2,901 | $37,610 | $18,590 | $19,020 |
| 2016 | $3,449 | $42,300 | $5,365 | $36,935 |
Source: Public Records
Map
Nearby Homes
- 3227 Vine St
- 3216 N High St
- 2102 E Martin Luther King jr Blvd
- 3218 N High St
- 3139 Vine St
- 3326 N Williams St
- 3120 N Race St
- 3042 Vine St
- 3310 Gilpin St
- 3034 N High St
- 3432 Josephine St
- 3118 Gilpin St
- 3124 Gilpin St
- 3135 N Columbine St
- 3242 Columbine St
- 3314 Franklin St
- 3541 N Williams St
- 1803 E 36th Ave
- 3154 N Columbine St
- 3151 N Elizabeth St