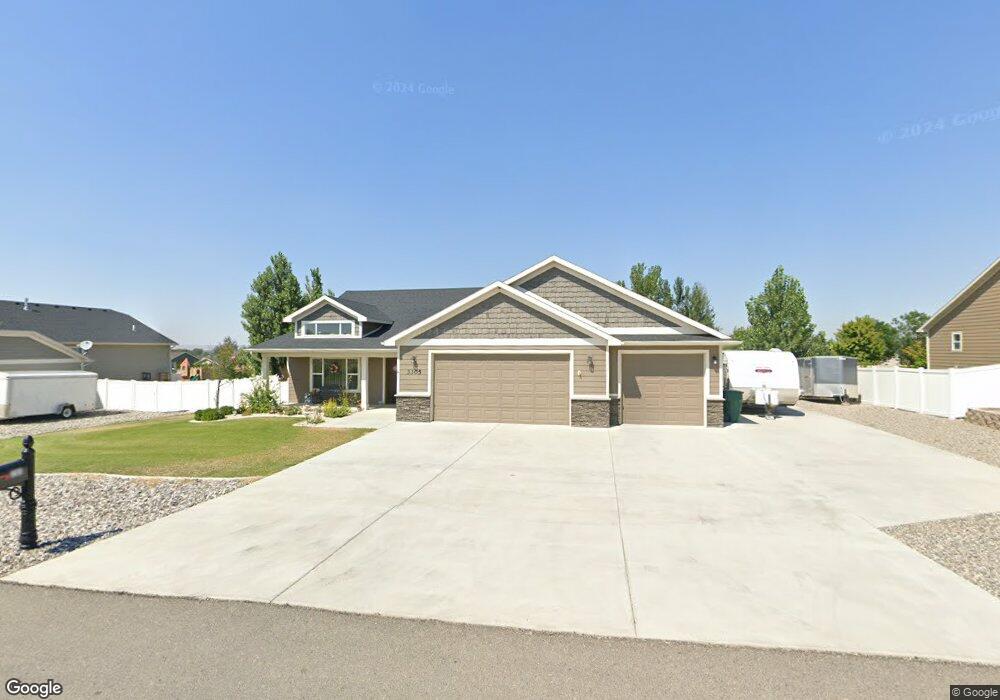
3305 Hidalgo Dr Billings, MT 59101
Lockwood NeighborhoodEstimated Value: $478,000 - $536,000
4
Beds
3
Baths
2,322
Sq Ft
$217/Sq Ft
Est. Value
About This Home
This home is located at 3305 Hidalgo Dr, Billings, MT 59101 and is currently estimated at $504,301, approximately $217 per square foot. 3305 Hidalgo Dr is a home with nearby schools including Lockwood Primary School, Lockwood Intermediate School, and Lockwood Middle School.
Ownership History
Date
Name
Owned For
Owner Type
Purchase Details
Closed on
Oct 20, 2017
Sold by
Rorabaugh Ronald L and Rorabaugh Phyllis D
Bought by
Rorabaugh Ronald L and Rorabaugh Phyllis D
Current Estimated Value
Purchase Details
Closed on
Oct 11, 2017
Sold by
Parisian Edward F and Parisian Barbara J
Bought by
Rorabaugh Ronald L and Rorabaugh Phyllis D
Purchase Details
Closed on
Sep 5, 2014
Sold by
Kennedy Matt
Bought by
Allen Mark A
Purchase Details
Closed on
Oct 25, 2013
Sold by
Rimrock Builders Inc
Bought by
Parisian Edward F and Parisian Barbara J
Home Financials for this Owner
Home Financials are based on the most recent Mortgage that was taken out on this home.
Original Mortgage
$237,600
Interest Rate
4.53%
Mortgage Type
New Conventional
Purchase Details
Closed on
May 2, 2013
Sold by
Kenmark Corp
Bought by
Rimrock Builders Inc
Create a Home Valuation Report for This Property
The Home Valuation Report is an in-depth analysis detailing your home's value as well as a comparison with similar homes in the area
Home Values in the Area
Average Home Value in this Area
Purchase History
| Date | Buyer | Sale Price | Title Company |
|---|---|---|---|
| Rorabaugh Ronald L | -- | First Montana Title | |
| Rorabaugh Ronald L | -- | First Montana Title | |
| Allen Mark A | -- | -- | |
| Kennedy Matt | -- | -- | |
| Allen Mark A | -- | -- | |
| Parisian Edward F | -- | None Available | |
| Rimrock Builders Inc | -- | None Available |
Source: Public Records
Mortgage History
| Date | Status | Borrower | Loan Amount |
|---|---|---|---|
| Previous Owner | Parisian Edward F | $237,600 |
Source: Public Records
Tax History Compared to Growth
Tax History
| Year | Tax Paid | Tax Assessment Tax Assessment Total Assessment is a certain percentage of the fair market value that is determined by local assessors to be the total taxable value of land and additions on the property. | Land | Improvement |
|---|---|---|---|---|
| 2025 | $1,835 | $497,700 | $77,086 | $420,614 |
| 2024 | $1,835 | $442,900 | $74,110 | $368,790 |
| 2023 | $3,017 | $442,900 | $74,110 | $368,790 |
| 2022 | $1,568 | $336,500 | $0 | $0 |
| 2021 | $2,867 | $336,500 | $0 | $0 |
| 2020 | $2,780 | $327,100 | $0 | $0 |
| 2019 | $2,138 | $327,100 | $0 | $0 |
| 2018 | $1,984 | $302,300 | $0 | $0 |
| 2017 | $2,150 | $287,200 | $0 | $0 |
| 2016 | $2,825 | $268,400 | $0 | $0 |
| 2015 | $2,742 | $268,400 | $0 | $0 |
| 2014 | $2,754 | $139,761 | $0 | $0 |
Source: Public Records
Map
Nearby Homes
- 3340 Hidalgo Dr
- TBD Navarro Rd
- 505 El Molino St
- TBD San Marino Dr
- 3306 Becraft Ln
- 85 Eagle Cliff Meadows
- 440 Summertime Way
- 430 Sunlight Cir
- 420 Sunlight Cir
- 410 Sunlight Cir
- 400 Sunlight Cir
- 320 Sunlight Cir
- 325 Sunlight Cir
- 405 Sunlight Cir
- 435 Sunlight Cir
- 465 Summertime Way
- 90 Sunlight Cir
- TBD Sunlight Cir
- 130 Sunlight Cir
- 3840 Dylan Dr
- 3305 Hidalgo Dr
- 3265 Hidalgo Dr
- 0 Hidalgo Dr
- 3315 Hidalgo Dr
- 3300 La Paz Dr
- 3300 Hidalgo Dr
- 3300 Hidalgo Dr
- 3280 La Paz Dr
- 3330 La Paz Dr
- 3255 Hidalgo Dr
- 3270 Hidalgo Dr
- 3320 Hidalgo Dr
- 3320 Hidalgo Dr
- 3335 Hidalgo Dr
- 3350 La Paz Dr
- 3260 La Paz Dr
- 345 Toledo St
- 3250 Hidalgo Dr
- 3285 La Paz Dr
- 3315 La Paz Dr