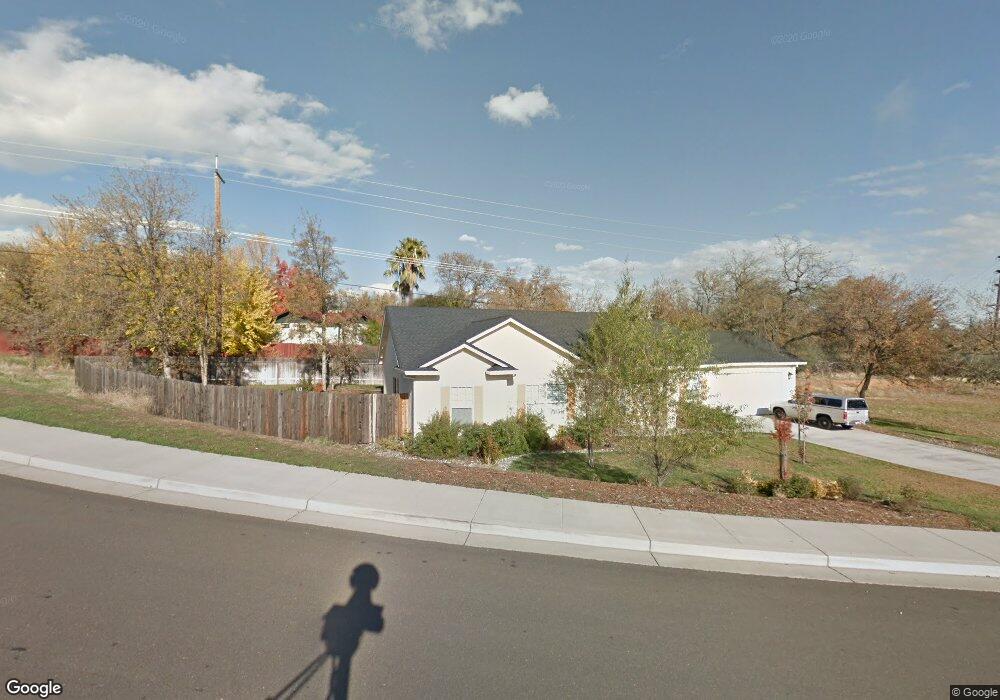
3305 Piper Way Redding, CA 96001
Manzanita NeighborhoodEstimated Value: $403,000 - $452,000
4
Beds
2
Baths
1,800
Sq Ft
$235/Sq Ft
Est. Value
About This Home
This home is located at 3305 Piper Way, Redding, CA 96001 and is currently estimated at $422,211, approximately $234 per square foot. 3305 Piper Way is a home located in Shasta County with nearby schools including Manzanita Elementary School, Sequoia Middle School, and Shasta High School.
Ownership History
Date
Name
Owned For
Owner Type
Purchase Details
Closed on
Dec 22, 2023
Sold by
Michael And Sheril Jones Family Revocabl
Bought by
Tccmjj 2 Llc
Current Estimated Value
Purchase Details
Closed on
Oct 10, 2013
Sold by
Jones Michael K and Jones Sheril J
Bought by
Jones Michael and Jones Sheril
Purchase Details
Closed on
Apr 30, 2008
Sold by
Zoll Daniel and Zoll Cynthia A
Bought by
Jones Michael K and Jones Sheril J
Home Financials for this Owner
Home Financials are based on the most recent Mortgage that was taken out on this home.
Original Mortgage
$80,000
Interest Rate
5.81%
Mortgage Type
Unknown
Create a Home Valuation Report for This Property
The Home Valuation Report is an in-depth analysis detailing your home's value as well as a comparison with similar homes in the area
Home Values in the Area
Average Home Value in this Area
Purchase History
| Date | Buyer | Sale Price | Title Company |
|---|---|---|---|
| Tccmjj 2 Llc | -- | None Listed On Document | |
| Jones Michael | -- | First American Title Co | |
| Jones Michael K | $400,000 | Placer Title Company |
Source: Public Records
Mortgage History
| Date | Status | Borrower | Loan Amount |
|---|---|---|---|
| Previous Owner | Jones Michael K | $80,000 | |
| Previous Owner | Jones Michael K | $1,100,000 |
Source: Public Records
Tax History
| Year | Tax Paid | Tax Assessment Tax Assessment Total Assessment is a certain percentage of the fair market value that is determined by local assessors to be the total taxable value of land and additions on the property. | Land | Improvement |
|---|---|---|---|---|
| 2025 | $4,300 | $375,752 | $86,013 | $289,739 |
| 2024 | $4,225 | $368,385 | $84,327 | $284,058 |
| 2023 | $4,225 | $361,163 | $82,674 | $278,489 |
| 2022 | $4,150 | $354,082 | $81,053 | $273,029 |
| 2021 | $4,119 | $347,140 | $79,464 | $267,676 |
| 2020 | $4,124 | $343,582 | $78,650 | $264,932 |
| 2019 | $3,781 | $325,000 | $60,000 | $265,000 |
| 2018 | $3,782 | $315,000 | $60,000 | $255,000 |
| 2017 | $3,408 | $285,600 | $70,000 | $215,600 |
| 2016 | $3,342 | $280,000 | $70,000 | $210,000 |
| 2015 | $3,167 | $276,000 | $65,000 | $211,000 |
| 2014 | $3,291 | $276,000 | $65,000 | $211,000 |
Source: Public Records
Map
Nearby Homes
- 3380 Placer St
- 3658 Rosita Dr
- 3345 Oakwood Place
- 3701 Cal Ore Dr
- 1355 Bambury Ct
- 1525 Oak St
- 1425 Pleasant St
- 3882 Fujiyama Way
- 1688 El Capitan Dr
- 4000 Meander Dr
- 1433 Lakeside Dr
- 3126 Riesling Path
- 4065 Meander Dr
- 3782 Siskiyou St
- 4160 Travona Ct
- 3510 Eureka Way
- 4125 Oro St
- 1430 Ridge Dr
- 1692 Kildare Dr
- 4185 Meander Dr
Your Personal Tour Guide
Ask me questions while you tour the home.