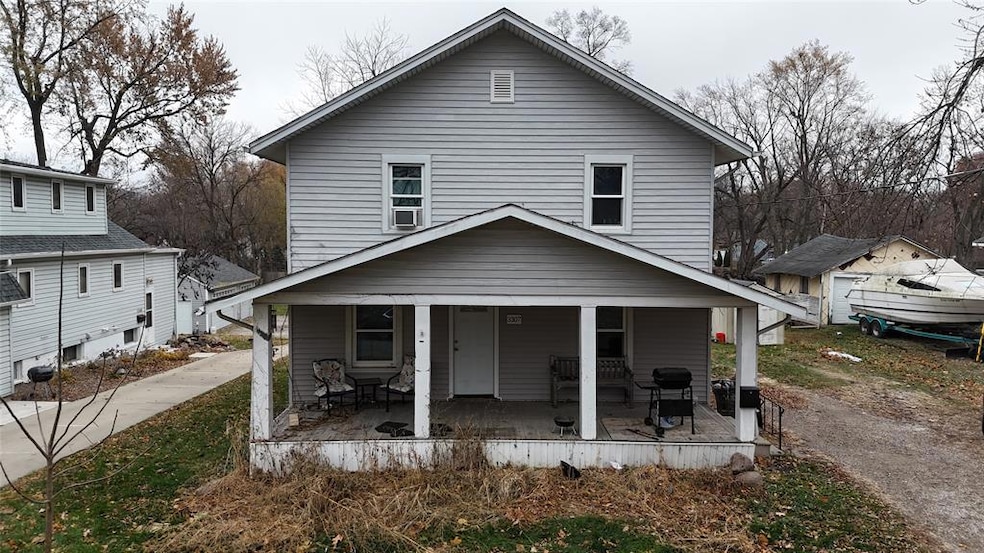
3307 50th St Des Moines, IA 50310
Merle Hay NeighborhoodEstimated payment $1,214/month
Highlights
- 0.45 Acre Lot
- Tile Flooring
- Forced Air Heating and Cooling System
- No HOA
About This Home
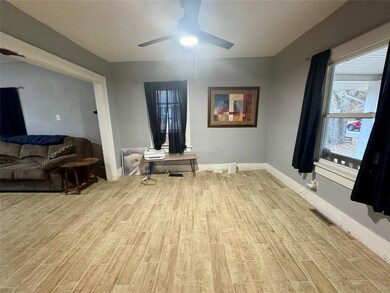
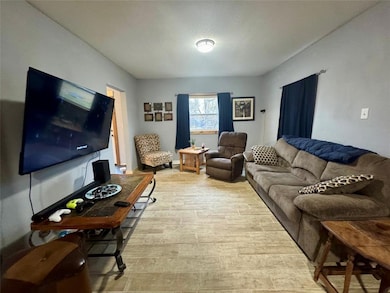
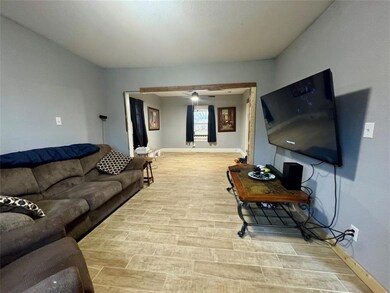
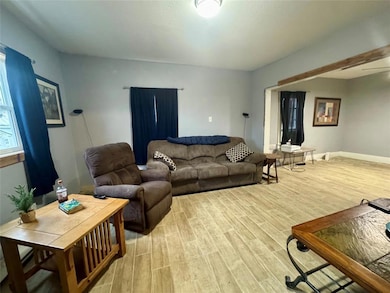
Step into the character and charm of this 1915 Des Moines home offering 4 bedrooms, 1 bath, and 1,352 sq ft of living space on an impressive 0.45-acre lot. The oversized yard—nearly 20,000 sq ft—creates a rare sense of privacy and room to expand, garden, entertain, or add future amenities. Inside, the home features seven total rooms with flexible layout options, making it easy to fit a variety of lifestyles. Whether you need extra bedrooms, a home office, or a creative space, this property gives you options. Located in an established neighborhood in the heart of Des Moines, this home provides quick access to local parks, schools, retail, and commuter routes. A great opportunity for an owner-occupant or investor looking for a large lot and a property with plenty of upside. Homes with this kind of lot size inside the city don’t come around often—this one is ready for its next chapter.
Home Details
Home Type
- Single Family
Est. Annual Taxes
- $3,790
Year Built
- Built in 1915
Lot Details
- 0.45 Acre Lot
- Lot Dimensions are 64x307
- Property is zoned N3B
Interior Spaces
- 1,352 Sq Ft Home
- 2-Story Property
- Unfinished Basement
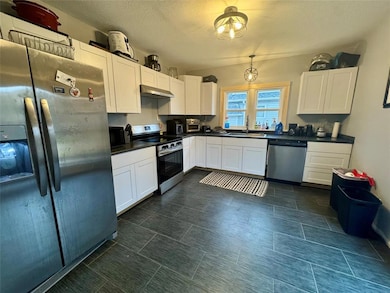
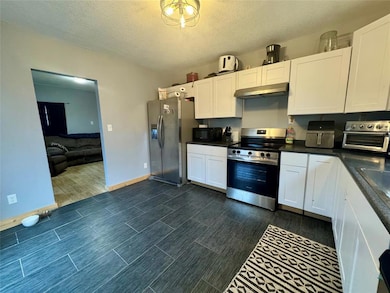
Kitchen
- Stove
- Dishwasher
Flooring
- Carpet
- Tile
- Vinyl
Bedrooms and Bathrooms
- 4 Bedrooms
- 1 Full Bathroom
Utilities
- Forced Air Heating and Cooling System
Community Details
- No Home Owners Association
Listing and Financial Details
- Assessor Parcel Number 10001203000000
Map
Home Values in the Area
Average Home Value in this Area
Tax History
| Year | Tax Paid | Tax Assessment Tax Assessment Total Assessment is a certain percentage of the fair market value that is determined by local assessors to be the total taxable value of land and additions on the property. | Land | Improvement |
|---|---|---|---|---|
| 2025 | $3,708 | $197,900 | $68,900 | $129,000 |
| 2024 | $3,708 | $199,000 | $61,200 | $137,800 |
| 2023 | $3,784 | $199,000 | $61,200 | $137,800 |
| 2022 | $3,752 | $169,400 | $53,100 | $116,300 |
| 2021 | $3,648 | $169,400 | $53,100 | $116,300 |
| 2020 | $3,784 | $154,800 | $48,900 | $105,900 |
| 2019 | $3,420 | $154,800 | $48,900 | $105,900 |
| 2018 | $3,380 | $135,800 | $42,500 | $93,300 |
| 2017 | $3,126 | $135,800 | $42,500 | $93,300 |
| 2016 | $3,040 | $124,100 | $38,800 | $85,300 |
| 2015 | $3,040 | $124,100 | $38,800 | $85,300 |
| 2014 | $2,756 | $112,400 | $35,000 | $77,400 |
Property History
| Date | Event | Price | List to Sale | Price per Sq Ft |
|---|---|---|---|---|
| 11/21/2025 11/21/25 | For Sale | $170,000 | -- | $126 / Sq Ft |
Purchase History
| Date | Type | Sale Price | Title Company |
|---|---|---|---|
| Quit Claim Deed | -- | None Listed On Document | |
| Quit Claim Deed | -- | None Listed On Document | |
| Contract Of Sale | $71,500 | -- | |
| Warranty Deed | $31,500 | -- |
Mortgage History
| Date | Status | Loan Amount | Loan Type |
|---|---|---|---|
| Previous Owner | $71,500 | Land Contract Argmt. Of Sale |
Source: Des Moines Area Association of REALTORS®
MLS Number: 730683
APN: 100-01203000000
Disclaimer: Certain information contained herein is derived from information provided by parties other than Homes.com. All information provided is deemed reliable, but is not guaranteed to be accurate and should be independently verified.
![]() IDX information is provided exclusively for personal, non-commercial use, and may not be used for any purpose other than to identify prospective properties consumers may be interested in purchasing. Information is deemed reliable but not guaranteed.
IDX information is provided exclusively for personal, non-commercial use, and may not be used for any purpose other than to identify prospective properties consumers may be interested in purchasing. Information is deemed reliable but not guaranteed.
- 3330 52nd St
- 2923 49th Place
- 4532 Douglas Ave
- 3710 56th St
- 5626 Douglas Ave
- 4926 Madison Ave
- 3720 57th St
- 4031 51st St
- 5813 New York Ave
- 6038 Urbandale Ave
- 4131 55th St
- 2107 52nd St Unit 2017
- 4925 Franklin Ave
- 5113 Lincoln Ave Unit 5113
- 3828 40th St
- 6316 Urbandale Ave
- 6813 Douglas Ave
- 5902 Hickman Rd
- 5501 Aurora Ave
- 2300 Beaver Ave
