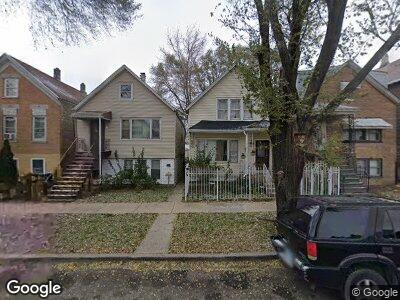
3308 W 37th Place Chicago, IL 60632
Brighton Park NeighborhoodEstimated Value: $157,000 - $268,000
3
Beds
1
Bath
632
Sq Ft
$344/Sq Ft
Est. Value
About This Home
This home is located at 3308 W 37th Place, Chicago, IL 60632 and is currently estimated at $217,321, approximately $343 per square foot. 3308 W 37th Place is a home located in Cook County with nearby schools including Calmeca Academy Elementary School, Kelly High School, and Acero - Sandra Cisneros Elementary School.
Ownership History
Date
Name
Owned For
Owner Type
Purchase Details
Closed on
Jan 31, 2012
Sold by
U S Bank National Association
Bought by
Madrigal Silvia
Current Estimated Value
Purchase Details
Closed on
Jun 30, 2008
Sold by
Lopez Hermelinda
Bought by
Lasalle Bank Na and Gsamp Trust 2007-H
Purchase Details
Closed on
Jul 14, 2006
Sold by
Vallejo Alfredo
Bought by
Lopez Hermelinda
Home Financials for this Owner
Home Financials are based on the most recent Mortgage that was taken out on this home.
Original Mortgage
$185,000
Interest Rate
9.77%
Mortgage Type
Balloon
Purchase Details
Closed on
Sep 19, 1997
Sold by
Hud
Bought by
Vallejo Alfredo
Home Financials for this Owner
Home Financials are based on the most recent Mortgage that was taken out on this home.
Original Mortgage
$40,800
Interest Rate
11.1%
Purchase Details
Closed on
Nov 21, 1996
Sold by
The Judicial Sales Corp
Bought by
Hud
Create a Home Valuation Report for This Property
The Home Valuation Report is an in-depth analysis detailing your home's value as well as a comparison with similar homes in the area
Home Values in the Area
Average Home Value in this Area
Purchase History
| Date | Buyer | Sale Price | Title Company |
|---|---|---|---|
| Madrigal Silvia | $50,000 | Cti | |
| Lasalle Bank Na | -- | None Available | |
| Lopez Hermelinda | $185,000 | Law Title Insurance | |
| Vallejo Alfredo | -- | -- |
Source: Public Records
Mortgage History
| Date | Status | Borrower | Loan Amount |
|---|---|---|---|
| Previous Owner | Lopez Hermelinda | $185,000 | |
| Previous Owner | Vallejo Alfredo | $70,000 | |
| Previous Owner | Vallejo Alfredo | $40,800 |
Source: Public Records
Tax History Compared to Growth
Tax History
| Year | Tax Paid | Tax Assessment Tax Assessment Total Assessment is a certain percentage of the fair market value that is determined by local assessors to be the total taxable value of land and additions on the property. | Land | Improvement |
|---|---|---|---|---|
| 2024 | $2,546 | $12,000 | $7,998 | $4,002 |
| 2023 | $2,546 | $12,307 | $7,750 | $4,557 |
| 2022 | $2,546 | $12,307 | $7,750 | $4,557 |
| 2021 | $2,475 | $12,306 | $7,750 | $4,556 |
| 2020 | $2,598 | $11,586 | $6,200 | $5,386 |
| 2019 | $2,632 | $13,019 | $6,200 | $6,819 |
| 2018 | $2,588 | $13,019 | $6,200 | $6,819 |
| 2017 | $2,882 | $13,300 | $5,270 | $8,030 |
| 2016 | $2,681 | $13,300 | $5,270 | $8,030 |
| 2015 | $2,455 | $13,300 | $5,270 | $8,030 |
| 2014 | $2,508 | $13,414 | $3,720 | $9,694 |
| 2013 | $2,459 | $13,414 | $3,720 | $9,694 |
Source: Public Records
Map
Nearby Homes
- 2929 W 38th St
- 3738 S Albany Ave
- 3512 W 38th Place
- 3807 S Albany Ave
- 3125 W Pershing Rd
- 3119 W 40th St
- 2913 W 38th St
- 3533 S Francisco Ave
- 2906 W 40th St
- 2835 W 38th Place
- 2828 W 36th Place
- 3145 W 42nd St
- 2853 W 40th St
- 3609 S California Ave
- 2814 W 40th St
- 4310 S Sawyer Ave
- 2740 W 35th Place
- 2714 W 37th Place
- 2717 W 38th St
- 2728 W 39th Place
- 3308 W 37th Place
- 3306 W 37th Place
- 3306 W 37th Place
- 3310 W 37th Place
- 3302 W 37th Place
- 3312 W 37th Place Unit 1
- 3314 W 37th Place
- 3300 W 37th Place
- 3318 W 37th Place
- 3320 W 37th Place
- 3322 W 37th Place
- 3322 W 37th Place
- 3313 W 37th Place Unit 2
- 3309 W 37th Place
- 3311 W 37th Place
- 3307 W 37th Place
- 3328 W 37th Place
- 3301 W 37th Place
- 3319 W 37th Place
- 3321 W 37th Place