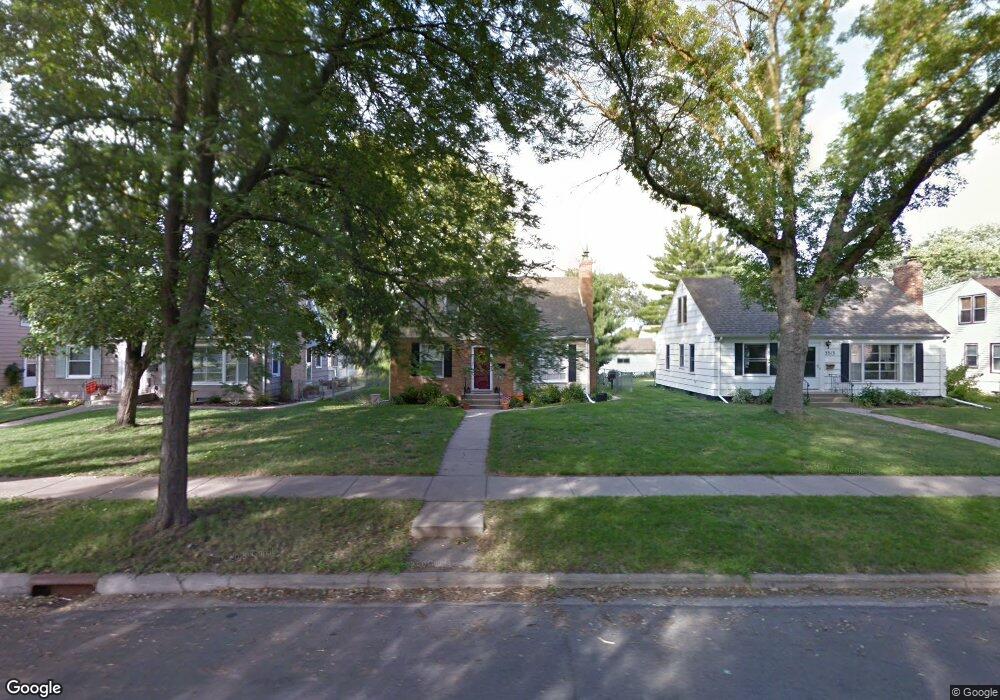
3309 3309 Library-Lane- St. Louis Park, MN 55426
Lenox NeighborhoodEstimated Value: $417,237 - $446,000
3
Beds
2
Baths
1,242
Sq Ft
$344/Sq Ft
Est. Value
About This Home
This home is located at 3309 3309 Library-Lane-, St. Louis Park, MN 55426 and is currently estimated at $427,559, approximately $344 per square foot. 3309 3309 Library-Lane- is a home located in Hennepin County with nearby schools including Peter Hobart Elementary School, St. Louis Park Middle School, and St. Louis Park High School.
Ownership History
Date
Name
Owned For
Owner Type
Purchase Details
Closed on
Jul 2, 2021
Sold by
Gandolph Jacob and Gandolph Kathryn
Bought by
Dearborn Margot Fawcett and Marsh Nicholas Scott
Current Estimated Value
Home Financials for this Owner
Home Financials are based on the most recent Mortgage that was taken out on this home.
Original Mortgage
$369,000
Outstanding Balance
$334,810
Interest Rate
2.9%
Mortgage Type
New Conventional
Estimated Equity
$92,749
Purchase Details
Closed on
Oct 30, 2008
Sold by
Barrington Peter J
Bought by
Gandolph Jacob and Gandolph Kathryn
Purchase Details
Closed on
Mar 31, 2005
Sold by
Olson Todd
Bought by
Barrington Peter J
Purchase Details
Closed on
Oct 17, 2001
Sold by
Spannaus Susan C
Bought by
Schulte Kristina M and Olson Todd D
Create a Home Valuation Report for This Property
The Home Valuation Report is an in-depth analysis detailing your home's value as well as a comparison with similar homes in the area
Home Values in the Area
Average Home Value in this Area
Purchase History
| Date | Buyer | Sale Price | Title Company |
|---|---|---|---|
| Dearborn Margot Fawcett | $410,000 | Edina Realty Title Inc | |
| Gandolph Jacob | $244,000 | -- | |
| Barrington Peter J | $245,000 | -- | |
| Schulte Kristina M | $199,900 | -- | |
| Dearborn Margot Margot | $410,000 | -- |
Source: Public Records
Mortgage History
| Date | Status | Borrower | Loan Amount |
|---|---|---|---|
| Open | Dearborn Margot Fawcett | $369,000 | |
| Closed | Dearborn Margot Margot | $369,000 |
Source: Public Records
Tax History Compared to Growth
Tax History
| Year | Tax Paid | Tax Assessment Tax Assessment Total Assessment is a certain percentage of the fair market value that is determined by local assessors to be the total taxable value of land and additions on the property. | Land | Improvement |
|---|---|---|---|---|
| 2024 | $4,689 | $347,800 | $143,900 | $203,900 |
| 2023 | $4,655 | $354,100 | $143,900 | $210,200 |
| 2022 | $4,175 | $353,400 | $143,200 | $210,200 |
| 2021 | $3,753 | $319,300 | $124,600 | $194,700 |
| 2020 | $3,881 | $292,600 | $118,700 | $173,900 |
| 2019 | $3,693 | $290,500 | $113,100 | $177,400 |
| 2018 | $3,559 | $269,100 | $107,800 | $161,300 |
| 2017 | $2,681 | $202,800 | $85,300 | $117,500 |
| 2016 | $2,965 | $214,100 | $77,000 | $137,100 |
| 2015 | $3,096 | $216,300 | $72,000 | $144,300 |
| 2014 | -- | $198,900 | $68,300 | $130,600 |
Source: Public Records
Map
Nearby Homes
- 3332 Idaho Ave S
- 3338 Library Ln
- 3267 Library Ln
- 3308 Brownlow Ave
- 3251 Louisiana Ave S Unit 304
- 3379 Brownlow Ave
- 3216 Kentucky Ave S
- 3145 Idaho Ave S
- 3320 Louisiana Ave S Unit 410
- 3300 Louisiana Ave S Unit 422
- 3300 Louisiana Ave S Unit 523
- 3320 Louisiana Ave S Unit 310
- 3149 Kentucky Ave S
- 3200 Edgewood Ave S
- 3153 Nevada Ave S
- 3149 Nevada Ave S
- 3124 Maryland Ave S
- 7005 Minnetonka Blvd
- 3248 Alabama Ave S
- 7100 Minnetonka Blvd
- 3309 Library Ln
- 3313 3313 Library-Lane-
- 3313 Library Ln
- 3305 Library Ln
- 3317 Library Ln
- 3301 Library Ln
- 3321 Library Ln
- 3308 Library Ln
- 3312 Library Ln
- 3304 Library Ln
- 3300 Library Ln
- 3318 Library Ln
- 3312 Idaho Ave S
- 3312 Idaho Ave S
- 3325 Library Ln
- 3304 Idaho Ave S
- 3289 Library Ln
- 3325 3325 Library Ln
- 3316 Idaho Ave S
- 3300 Idaho Ave S