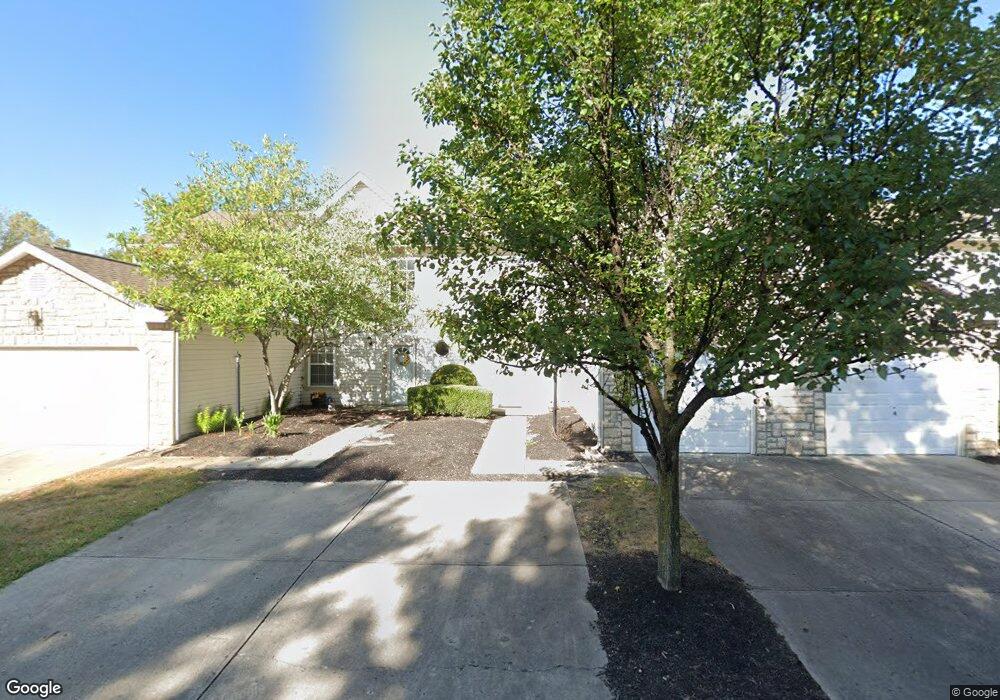
3309 Joshstock Dr Unit 3309B Columbus, OH 43232
Walnut Heights NeighborhoodEstimated Value: $197,000 - $220,000
3
Beds
3
Baths
1,440
Sq Ft
$143/Sq Ft
Est. Value
About This Home
This home is located at 3309 Joshstock Dr Unit 3309B, Columbus, OH 43232 and is currently estimated at $205,631, approximately $142 per square foot. 3309 Joshstock Dr Unit 3309B is a home located in Franklin County with nearby schools including Groveport Madison High School, A+ Arts Academy, and Eastland Preparatory Academy.
Ownership History
Date
Name
Owned For
Owner Type
Purchase Details
Closed on
Sep 13, 2012
Sold by
Morris Bryan W
Bought by
Gonzales Maura T
Current Estimated Value
Home Financials for this Owner
Home Financials are based on the most recent Mortgage that was taken out on this home.
Original Mortgage
$38,400
Outstanding Balance
$26,596
Interest Rate
3.59%
Mortgage Type
New Conventional
Estimated Equity
$179,035
Purchase Details
Closed on
May 19, 2008
Sold by
Brady Stephen J and Schepman Kevin S
Bought by
Morris Bryan W
Home Financials for this Owner
Home Financials are based on the most recent Mortgage that was taken out on this home.
Original Mortgage
$104,263
Interest Rate
5.93%
Mortgage Type
FHA
Purchase Details
Closed on
Dec 27, 2004
Sold by
Maronda Homes Inc
Bought by
Brady Stephen J and Schepman Kevin S
Create a Home Valuation Report for This Property
The Home Valuation Report is an in-depth analysis detailing your home's value as well as a comparison with similar homes in the area
Home Values in the Area
Average Home Value in this Area
Purchase History
| Date | Buyer | Sale Price | Title Company |
|---|---|---|---|
| Gonzales Maura T | $48,000 | Real Living Title | |
| Morris Bryan W | $105,900 | Chicago Tit | |
| Brady Stephen J | $109,300 | Chicago Title |
Source: Public Records
Mortgage History
| Date | Status | Borrower | Loan Amount |
|---|---|---|---|
| Open | Gonzales Maura T | $38,400 | |
| Previous Owner | Morris Bryan W | $104,263 |
Source: Public Records
Tax History Compared to Growth
Tax History
| Year | Tax Paid | Tax Assessment Tax Assessment Total Assessment is a certain percentage of the fair market value that is determined by local assessors to be the total taxable value of land and additions on the property. | Land | Improvement |
|---|---|---|---|---|
| 2024 | $2,431 | $57,330 | $8,750 | $48,580 |
| 2023 | $2,408 | $57,330 | $8,750 | $48,580 |
| 2022 | $1,481 | $29,330 | $4,060 | $25,270 |
| 2021 | $1,485 | $29,330 | $4,060 | $25,270 |
| 2020 | $1,488 | $29,330 | $4,060 | $25,270 |
| 2019 | $1,147 | $20,230 | $2,800 | $17,430 |
| 2018 | $1,393 | $20,230 | $2,800 | $17,430 |
| 2017 | $1,158 | $20,230 | $2,800 | $17,430 |
| 2016 | $1,614 | $25,760 | $4,340 | $21,420 |
| 2015 | $1,631 | $25,760 | $4,340 | $21,420 |
| 2014 | $1,650 | $25,760 | $4,340 | $21,420 |
| 2013 | $863 | $32,200 | $5,425 | $26,775 |
Source: Public Records
Map
Nearby Homes
- 3298 Joshstock Dr
- 3304 Joshstock Dr
- 3310 Joshstock Dr
- St Martin Plan at Chatterton Commons
- 5936 Abernathy Ln
- 5938 Abernathy Ln
- 5944 Abernathy Ln
- 5946 Abernathy Ln
- 5882 Abernathy Ln Unit 5882F
- 5960 Abernathy Ln
- 5962 Abernathy Ln
- 5968 Abernathy Ln
- 5970 Abernathy Ln
- 5976 Abernathy Ln
- 5978 Abernathy Ln
- 5957 Hollett Dr S
- 5969 Hollett Dr S
- 3057 Lamptonridge Dr
- 5987 Hollett Dr S
- 3198 Gallant Dr
- 3309 Joshstock Dr Unit B
- 3303 Joshstock Dr Unit 3303C
- 3303 Joshstock Dr Unit 2C
- 0 Joshstock Dr Unit 3309
- 5908 Morrissey St Unit 5908A
- 5886 Morrissey St Unit 5886F
- 5886 Morrissey St Unit 8F
- 5910 Morrissey St Unit 5910B
- 5916 Morrissey St Unit 5916C
- 5884 Morrissey St Unit 5884E
- 5884 Morrissey St Unit 8E
- 5918 Morrissey St Unit 5918D
- 5878 Morrissey St Unit 5878D
- 5878 Morrissey St Unit 8D
- 5876 Morrissey St Unit 5876C
- 5876 Morrissey St Unit 8C
- 5926 Morrissey St Unit 5926F
- 5870 Morrissey St Unit 5870B
- 5870 Morrissey St Unit 8B
- 3278 Edinwick Way Unit 3278D