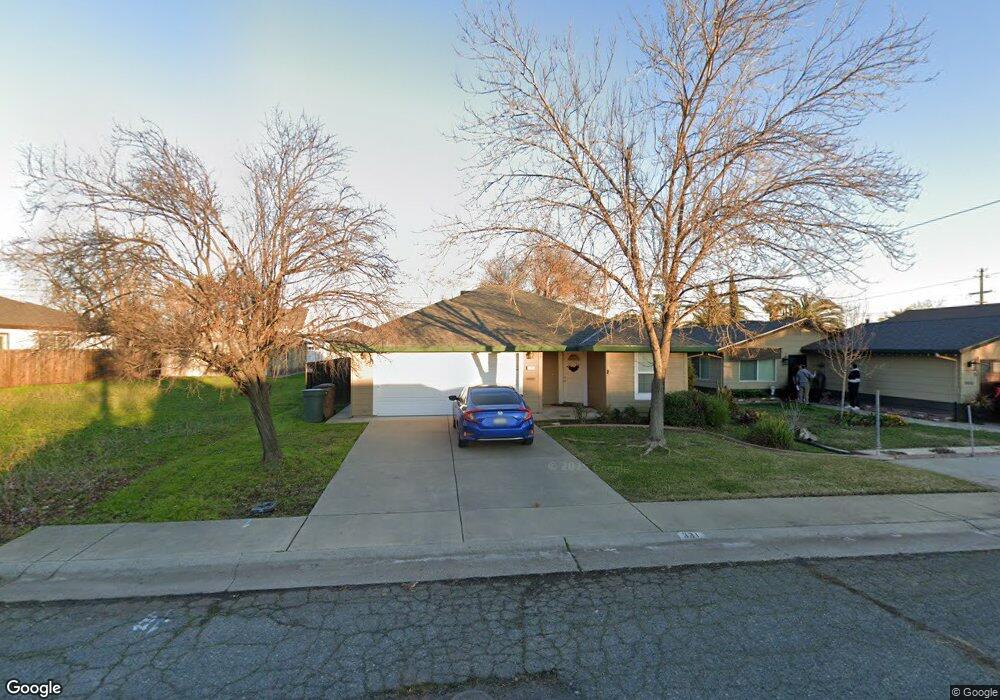
331 K St Lincoln, CA 95648
Estimated Value: $365,000 - $452,830
3
Beds
2
Baths
1,149
Sq Ft
$372/Sq Ft
Est. Value
About This Home
This home is located at 331 K St, Lincoln, CA 95648 and is currently estimated at $426,958, approximately $371 per square foot. 331 K St is a home located in Placer County with nearby schools including First Street, Glen Edwards Middle, and Lincoln High.
Ownership History
Date
Name
Owned For
Owner Type
Purchase Details
Closed on
Dec 19, 2003
Sold by
Anable Richard J and Anable Sherry B
Bought by
Demere John and Demere Maria
Current Estimated Value
Home Financials for this Owner
Home Financials are based on the most recent Mortgage that was taken out on this home.
Original Mortgage
$193,600
Outstanding Balance
$90,649
Interest Rate
6.03%
Mortgage Type
Purchase Money Mortgage
Estimated Equity
$336,309
Purchase Details
Closed on
May 23, 2002
Sold by
Anable Richard and Anable Sherry
Bought by
Anable Richard J and Anable Sherry B
Home Financials for this Owner
Home Financials are based on the most recent Mortgage that was taken out on this home.
Original Mortgage
$88,500
Interest Rate
6.94%
Mortgage Type
Construction
Purchase Details
Closed on
Feb 27, 2001
Sold by
Mansueti Alice
Bought by
Anable Richard and Anable Sherry
Create a Home Valuation Report for This Property
The Home Valuation Report is an in-depth analysis detailing your home's value as well as a comparison with similar homes in the area
Home Values in the Area
Average Home Value in this Area
Purchase History
| Date | Buyer | Sale Price | Title Company |
|---|---|---|---|
| Demere John | $243,500 | Alliance Title | |
| Anable Richard J | -- | Alliance Title Company | |
| Anable Richard | -- | -- |
Source: Public Records
Mortgage History
| Date | Status | Borrower | Loan Amount |
|---|---|---|---|
| Open | Demere John | $193,600 | |
| Previous Owner | Anable Richard J | $88,500 | |
| Closed | Demere John | $24,200 |
Source: Public Records
Tax History
| Year | Tax Paid | Tax Assessment Tax Assessment Total Assessment is a certain percentage of the fair market value that is determined by local assessors to be the total taxable value of land and additions on the property. | Land | Improvement |
|---|---|---|---|---|
| 2025 | $3,600 | $346,186 | $113,733 | $232,453 |
| 2023 | $3,600 | $332,745 | $109,317 | $223,428 |
| 2022 | $3,500 | $326,222 | $107,174 | $219,048 |
| 2021 | $3,432 | $319,826 | $105,073 | $214,753 |
| 2020 | $3,130 | $290,000 | $95,300 | $194,700 |
| 2019 | $3,325 | $310,341 | $101,957 | $208,384 |
| 2018 | $2,881 | $270,000 | $88,700 | $181,300 |
| 2017 | $2,845 | $270,000 | $88,700 | $181,300 |
| 2016 | $2,240 | $213,000 | $70,000 | $143,000 |
| 2015 | $2,162 | $207,000 | $68,000 | $139,000 |
| 2014 | $1,892 | $182,000 | $59,800 | $122,200 |
Source: Public Records
Map
Nearby Homes
- 394 Lincoln Blvd
- 1101 First St
- 908 Hollingsworth Ct
- 0 5th St
- 530 5th St
- 1259 Shirley Way
- 116 Crystalwood Way
- 28 Crystalwood Cir
- 2730 Bedell St
- 654 B St
- 622 Q St
- 301 Falkirk Ct
- 1743 Laehr Dr
- 961 Silverton Cir
- 149 E 5th St
- 1822 4th St
- 110 Northfield Ct
- 679 Wagon Wheel Ln
- 561 Rustic Ranch Ln
- 476 Navigator Dr
Your Personal Tour Guide
Ask me questions while you tour the home.