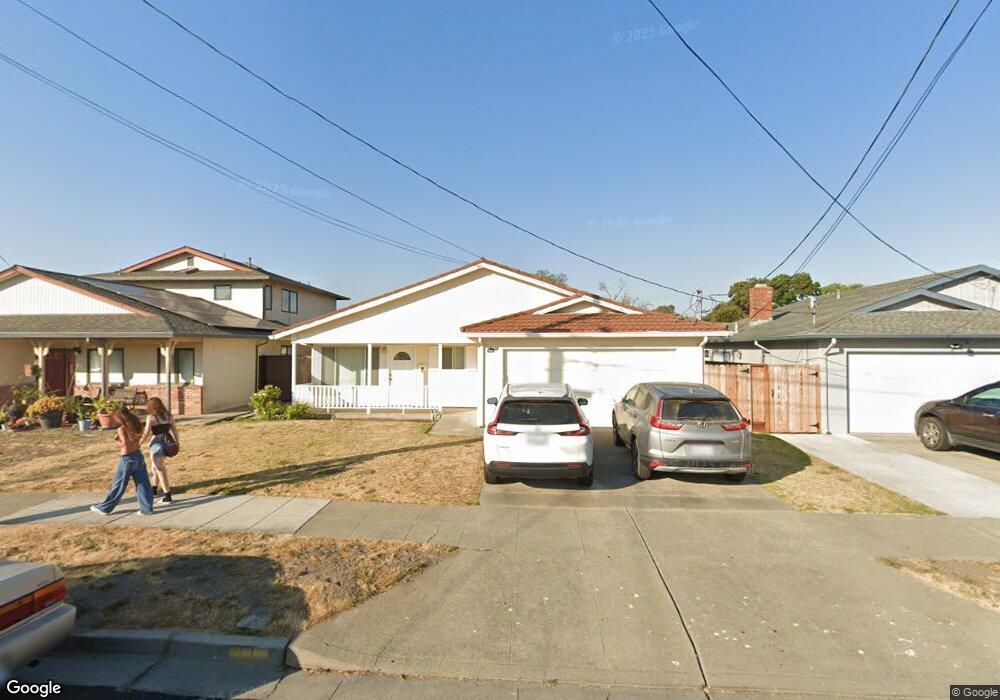
331 Magnolia Dr Alameda, CA 94502
Harbor Bay/Bay Farm NeighborhoodEstimated Value: $1,148,000 - $1,303,000
4
Beds
2
Baths
1,507
Sq Ft
$816/Sq Ft
Est. Value
About This Home
This home is located at 331 Magnolia Dr, Alameda, CA 94502 and is currently estimated at $1,229,078, approximately $815 per square foot. 331 Magnolia Dr is a home located in Alameda County with nearby schools including Amelia Earhart Elementary School, Lincoln Middle School, and Alameda High School.
Ownership History
Date
Name
Owned For
Owner Type
Purchase Details
Closed on
Jan 7, 2013
Sold by
Greenspan Richard L and Arndt Mary Katherine
Bought by
Greenspan Richard L and Arndt Mary Katherine
Current Estimated Value
Purchase Details
Closed on
Apr 19, 2000
Sold by
Sirca Donald M and Sirca Dolores A
Bought by
Greenspan Richard L and Greenspan Mary Arndt
Home Financials for this Owner
Home Financials are based on the most recent Mortgage that was taken out on this home.
Original Mortgage
$150,000
Outstanding Balance
$51,426
Interest Rate
8.24%
Estimated Equity
$1,177,652
Purchase Details
Closed on
Jan 18, 2000
Sold by
Wolters Sandra
Bought by
Sirca Donald M and Sirca Dolores A
Home Financials for this Owner
Home Financials are based on the most recent Mortgage that was taken out on this home.
Original Mortgage
$180,000
Interest Rate
7.84%
Purchase Details
Closed on
Aug 11, 1999
Sold by
Sirca Donald M and Sirca Dolores A
Bought by
Sirca Donald M and Sirca Dolores A
Create a Home Valuation Report for This Property
The Home Valuation Report is an in-depth analysis detailing your home's value as well as a comparison with similar homes in the area
Home Values in the Area
Average Home Value in this Area
Purchase History
| Date | Buyer | Sale Price | Title Company |
|---|---|---|---|
| Greenspan Richard L | -- | None Available | |
| Greenspan Richard L | $430,000 | First American Title Guarant | |
| Sirca Donald M | $130,000 | First American Title | |
| Sirca Donald M | -- | -- |
Source: Public Records
Mortgage History
| Date | Status | Borrower | Loan Amount |
|---|---|---|---|
| Open | Greenspan Richard L | $150,000 | |
| Previous Owner | Sirca Donald M | $180,000 |
Source: Public Records
Tax History Compared to Growth
Tax History
| Year | Tax Paid | Tax Assessment Tax Assessment Total Assessment is a certain percentage of the fair market value that is determined by local assessors to be the total taxable value of land and additions on the property. | Land | Improvement |
|---|---|---|---|---|
| 2025 | $8,956 | $653,862 | $230,533 | $430,329 |
| 2024 | $8,956 | $640,906 | $226,014 | $421,892 |
| 2023 | $8,588 | $635,204 | $221,583 | $413,621 |
| 2022 | $8,378 | $615,751 | $217,239 | $405,512 |
| 2021 | $8,155 | $603,543 | $212,980 | $397,563 |
| 2020 | $8,045 | $604,287 | $210,798 | $393,489 |
| 2019 | $7,934 | $592,440 | $206,665 | $385,775 |
| 2018 | $7,725 | $580,826 | $202,614 | $378,212 |
| 2017 | $7,353 | $569,440 | $198,642 | $370,798 |
| 2016 | $7,360 | $558,277 | $194,748 | $363,529 |
| 2015 | $7,333 | $549,892 | $191,823 | $358,069 |
| 2014 | $6,982 | $539,120 | $188,065 | $351,055 |
Source: Public Records
Map
Nearby Homes
- 1042 Mangrove Ln
- 3521 Oleander Ave
- 3525 Mcsherry Way
- 1083 Melrose Ave
- 1042 Jost Ln
- 3530 Depassier Way
- 133 Mecartney Rd
- 127 Maitland Dr
- 1031 Camellia Dr
- 3344 Solomon Ln
- 3337 Solomon Ln
- 3334 Solomon Ln
- 3315 Willis Ln
- 3308 Fir Ave
- 1117 Camino Del Valle
- 1160 Marianas Ln
- 3109 La Campania
- 1104 Verdemar Dr
- 327 Ratto Rd
- 510 Lagunaria Ln
- 327 Magnolia Dr
- 335 Magnolia Dr
- 339 Magnolia Dr
- 332 Maitland Dr
- 328 Maitland Dr
- 336 Maitland Dr
- 323 Magnolia Dr
- 340 Maitland Dr
- 343 Magnolia Dr
- 324 Maitland Dr
- 328 Magnolia Dr
- 332 Magnolia Dr
- 344 Maitland Dr
- 336 Magnolia Dr
- 3555 Magnolia Dr
- 320 Maitland Dr
- 347 Magnolia Dr
- 1034 Mangrove Ln
- 1038 Mangrove Ln
- 348 Maitland Dr