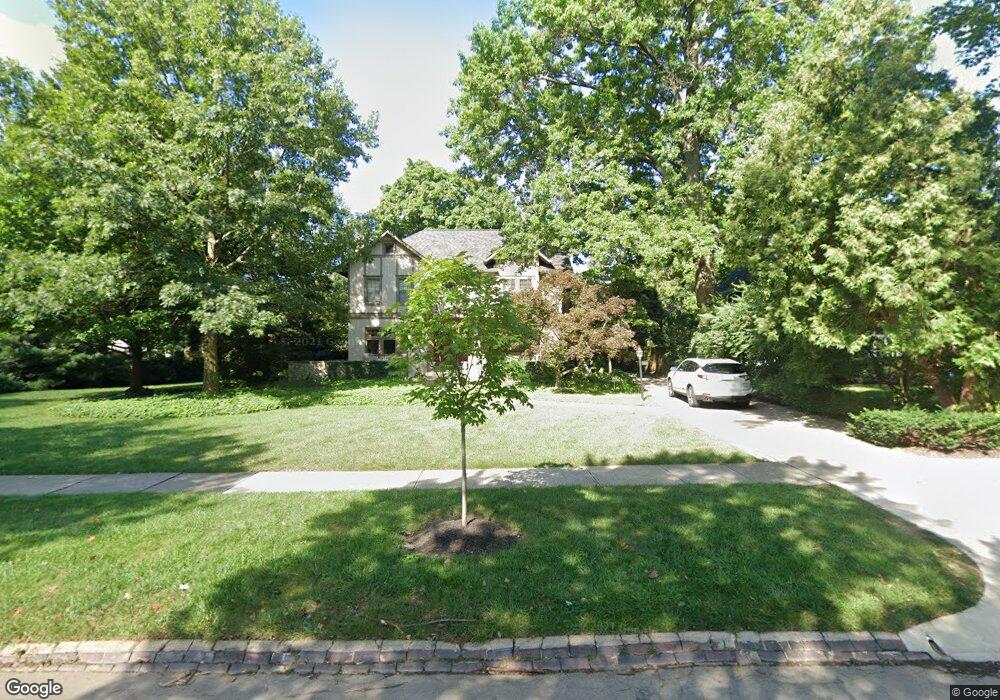
331 S Parkview Ave Columbus, OH 43209
Estimated Value: $1,225,366 - $1,447,000
4
Beds
4
Baths
3,591
Sq Ft
$381/Sq Ft
Est. Value
About This Home
This home is located at 331 S Parkview Ave, Columbus, OH 43209 and is currently estimated at $1,366,592, approximately $380 per square foot. 331 S Parkview Ave is a home located in Franklin County with nearby schools including Cassingham Elementary School, Bexley Middle School, and Bexley High School.
Ownership History
Date
Name
Owned For
Owner Type
Purchase Details
Closed on
Aug 28, 2025
Sold by
Vetter Thomas and Vetter Caitlin
Bought by
Vetter Caitlin
Current Estimated Value
Purchase Details
Closed on
Sep 25, 2020
Sold by
Halliday Peter B and Halliday Janet
Bought by
Vetter Thomas and Vetter Caitlin
Home Financials for this Owner
Home Financials are based on the most recent Mortgage that was taken out on this home.
Original Mortgage
$727,200
Interest Rate
2.9%
Mortgage Type
New Conventional
Purchase Details
Closed on
Mar 25, 2013
Sold by
Halliday Janet W
Bought by
Halliday Peter B and Halliday Janet
Home Financials for this Owner
Home Financials are based on the most recent Mortgage that was taken out on this home.
Original Mortgage
$417,000
Interest Rate
3.52%
Mortgage Type
New Conventional
Purchase Details
Closed on
Jun 4, 2004
Sold by
Halliday Janet W and Halliday Peter B
Bought by
Halliday Janet W
Purchase Details
Closed on
Jul 30, 1970
Bought by
Halliday Janet W
Create a Home Valuation Report for This Property
The Home Valuation Report is an in-depth analysis detailing your home's value as well as a comparison with similar homes in the area
Home Values in the Area
Average Home Value in this Area
Purchase History
| Date | Buyer | Sale Price | Title Company |
|---|---|---|---|
| Vetter Caitlin | -- | None Listed On Document | |
| Vetter Thomas | $925,000 | Amerititle Downtown | |
| Halliday Peter B | -- | None Available | |
| Halliday Janet W | -- | -- | |
| Halliday Janet W | -- | -- |
Source: Public Records
Mortgage History
| Date | Status | Borrower | Loan Amount |
|---|---|---|---|
| Previous Owner | Vetter Thomas | $727,200 | |
| Previous Owner | Halliday Peter B | $417,000 |
Source: Public Records
Tax History Compared to Growth
Tax History
| Year | Tax Paid | Tax Assessment Tax Assessment Total Assessment is a certain percentage of the fair market value that is determined by local assessors to be the total taxable value of land and additions on the property. | Land | Improvement |
|---|---|---|---|---|
| 2024 | $28,171 | $349,970 | $133,630 | $216,340 |
| 2023 | $17,473 | $349,965 | $133,630 | $216,335 |
| 2022 | $17,066 | $274,510 | $82,710 | $191,800 |
| 2021 | $17,079 | $274,510 | $82,710 | $191,800 |
| 2020 | $17,228 | $273,500 | $82,710 | $190,790 |
| 2019 | $17,825 | $248,960 | $75,180 | $173,780 |
| 2018 | $7,771 | $248,960 | $75,180 | $173,780 |
| 2017 | $15,192 | $248,960 | $75,180 | $173,780 |
| 2016 | $17,483 | $261,770 | $78,750 | $183,020 |
| 2015 | $8,773 | $261,770 | $78,750 | $183,020 |
| 2014 | $17,645 | $261,770 | $78,750 | $183,020 |
| 2013 | $8,115 | $237,965 | $71,575 | $166,390 |
Source: Public Records
Map
Nearby Homes
- 419 Westland Ave
- 211 Preston Rd
- 2350 Bryden Rd
- 57 Preston Rd
- 2430 Plymouth Ave
- 2455 Dale Ave
- 1833 Franklin Ave
- 2425 Bryden Rd
- 1000 S Dawson Ave Unit 302
- 1825-1827 Bryden Rd
- 268 S Cassady Ave
- 1779 E Main St
- 572 Bulen Ave
- 1714 Oak St
- 1800 E Fulton St
- 1692 Bryden Rd
- 395-397 Stoddart Ave
- 1747 E Mound St
- 1669-1671 Oak St
- 639 Bulen Ave
- 325 S Parkview Ave
- 332 Westland Ave
- 353 S Parkview Ave
- 311 S Parkview Ave
- 356 S Parkview Ave
- 295 S Parkview Ave
- 311 Westland Ave
- 2111 Park Hill Dr
- 375 S Parkview Ave
- 320 S Parkview Ave
- 360 S Parkview Ave
- 2123 Fair Ave
- 308 S Parkview Ave
- 2095 Park Hill Dr
- 387 S Parkview Ave
- 368 S Parkview Ave
- 368 S Parkview Ave Unit Bexley Studio
- 363 Westland Ave
- 277 S Parkview Ave