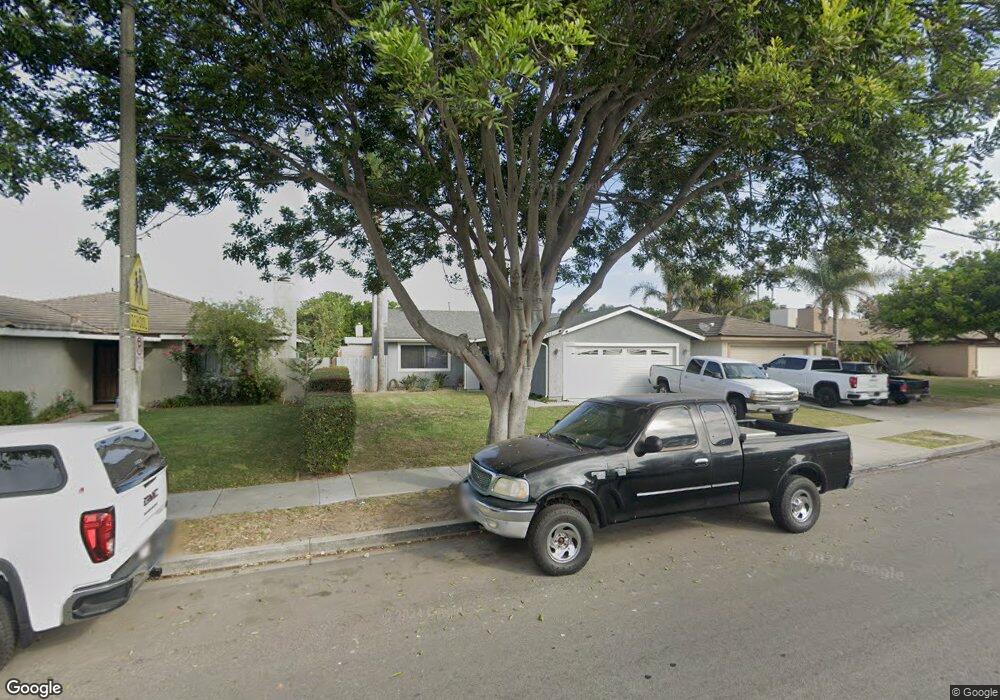
331 W Clara St Oxnard, CA 93033
South Winds NeighborhoodEstimated Value: $632,000 - $737,000
3
Beds
2
Baths
1,281
Sq Ft
$530/Sq Ft
Est. Value
About This Home
This home is located at 331 W Clara St, Oxnard, CA 93033 and is currently estimated at $678,598, approximately $529 per square foot. 331 W Clara St is a home located in Ventura County with nearby schools including Art Haycox Elementary School and Hueneme High School.
Ownership History
Date
Name
Owned For
Owner Type
Purchase Details
Closed on
Mar 13, 2025
Sold by
Cosio Maria
Bought by
Maria Cosio 2025 Trust and Cosio
Current Estimated Value
Purchase Details
Closed on
Oct 4, 2017
Sold by
Cosio Ortega Sergio and Cosio Ortega Maria
Bought by
Cosio Ortega Maria
Purchase Details
Closed on
Jul 30, 2003
Sold by
Ortega Sergio and Ortega Maria C
Bought by
Ortega Sergio
Home Financials for this Owner
Home Financials are based on the most recent Mortgage that was taken out on this home.
Original Mortgage
$190,000
Interest Rate
5.13%
Mortgage Type
Purchase Money Mortgage
Purchase Details
Closed on
Jan 16, 2001
Sold by
Ortega Sergio and Herman Carlos
Bought by
Ortega Sergio and Ortega Maria C
Purchase Details
Closed on
Jul 15, 1996
Sold by
Yang Lee Pa and Yang Mi Xiong
Bought by
Ortega Sergio and Herman Carlos
Home Financials for this Owner
Home Financials are based on the most recent Mortgage that was taken out on this home.
Original Mortgage
$131,544
Interest Rate
8.33%
Mortgage Type
FHA
Create a Home Valuation Report for This Property
The Home Valuation Report is an in-depth analysis detailing your home's value as well as a comparison with similar homes in the area
Home Values in the Area
Average Home Value in this Area
Purchase History
| Date | Buyer | Sale Price | Title Company |
|---|---|---|---|
| Maria Cosio 2025 Trust | -- | None Listed On Document | |
| Cosio Ortega Maria | -- | None Available | |
| Ortega Sergio | -- | Ticor Title Company | |
| Ortega Sergio | -- | -- | |
| Ortega Sergio | $133,000 | Fidelity National Title Co |
Source: Public Records
Mortgage History
| Date | Status | Borrower | Loan Amount |
|---|---|---|---|
| Previous Owner | Ortega Sergio | $190,000 | |
| Previous Owner | Ortega Sergio | $131,544 |
Source: Public Records
Tax History
| Year | Tax Paid | Tax Assessment Tax Assessment Total Assessment is a certain percentage of the fair market value that is determined by local assessors to be the total taxable value of land and additions on the property. | Land | Improvement |
|---|---|---|---|---|
| 2025 | $2,616 | $216,581 | $86,629 | $129,952 |
| 2024 | $2,616 | $212,335 | $84,931 | $127,404 |
| 2023 | $2,463 | $208,172 | $83,266 | $124,906 |
| 2022 | $2,413 | $204,091 | $81,634 | $122,457 |
| 2021 | $2,443 | $200,090 | $80,034 | $120,056 |
| 2020 | $2,487 | $198,040 | $79,214 | $118,826 |
| 2019 | $2,413 | $194,158 | $77,661 | $116,497 |
| 2018 | $2,325 | $190,352 | $76,139 | $114,213 |
| 2017 | $2,250 | $186,621 | $74,647 | $111,974 |
| 2016 | $2,144 | $182,963 | $73,184 | $109,779 |
| 2015 | $2,177 | $180,217 | $72,086 | $108,131 |
| 2014 | $2,138 | $176,689 | $70,675 | $106,014 |
Source: Public Records
Map
Nearby Homes
- 341 Cuesta Del Mar Dr
- 5302 Barrymore Dr
- 5225 Columbus Place
- 5340 S J St
- 5121 Perkins Rd
- 165 Courtyard Dr Unit 26
- 117 Ann Ave
- 912 Maplewood Way
- 218 Morning Breeze Ln
- 226 Morning Breeze Ln
- 433 Jerry Dr
- 4710 Clover Dr
- 5117 Jefferson Square
- 4200 S A St
- 916 Lighthouse Way
- 102 San Nicolas Cir
- 5222 Longfellow Way
- 605 Sunfish Way
- 846 Bluewater Way
- 320 Columbia Place Unit 46
- 341 W Clara St
- 321 W Clara St
- 351 W Clara St
- 311 W Clara St
- 330 Fairbourne Place
- 340 Fairbourne Place
- 320 Fairbourne Place
- 350 Fairbourne Place
- 361 W Clara St
- 301 W Clara St
- 310 Fairbourne Place
- 360 Fairbourne Place
- 371 W Clara St
- 300 Fairbourne Place
- 370 Fairbourne Place
- 241 W Clara St
- 331 Fairbourne Place
- 341 Fairbourne Place
- 321 Fairbourne Place
- 351 Fairbourne Place
Your Personal Tour Guide
Ask me questions while you tour the home.