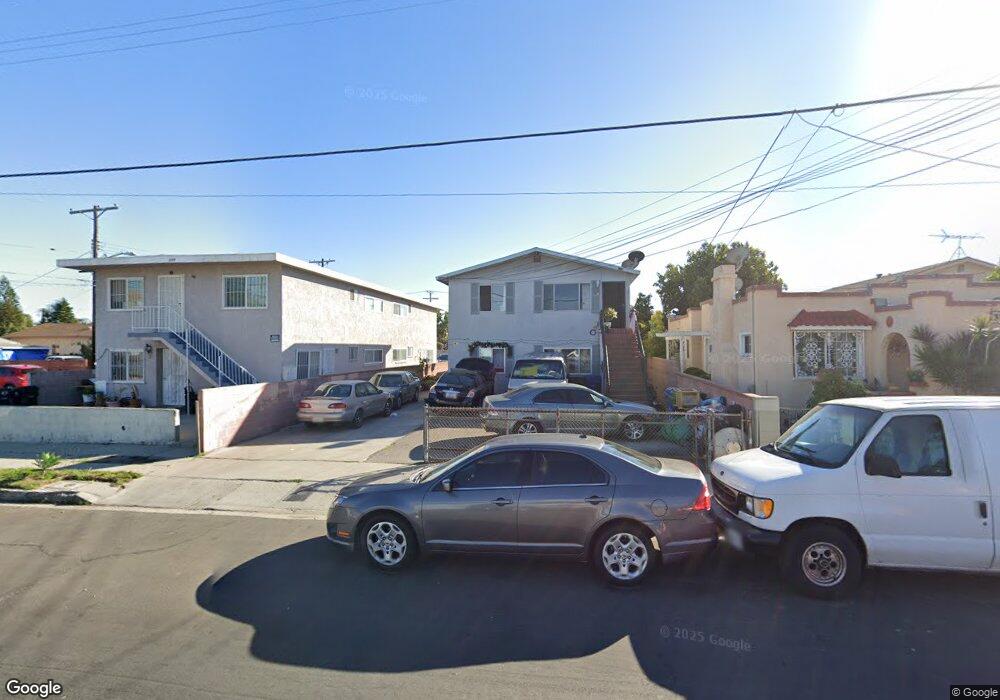
331 W Ofarrell St San Pedro, CA 90731
Estimated Value: $911,468 - $1,078,000
6
Beds
4
Baths
2,839
Sq Ft
$349/Sq Ft
Est. Value
About This Home
This home is located at 331 W Ofarrell St, San Pedro, CA 90731 and is currently estimated at $990,117, approximately $348 per square foot. 331 W Ofarrell St is a home located in Los Angeles County with nearby schools including Barton Hill Elementary School, Dana Middle School, and San Pedro Senior High School.
Ownership History
Date
Name
Owned For
Owner Type
Purchase Details
Closed on
Aug 25, 2008
Sold by
Berrera Alfredo
Bought by
The Alfredo Berrera Living Trust
Current Estimated Value
Purchase Details
Closed on
May 31, 2002
Sold by
Berganza Daniel Dejesus
Bought by
Barrera Alfredo
Home Financials for this Owner
Home Financials are based on the most recent Mortgage that was taken out on this home.
Original Mortgage
$220,000
Outstanding Balance
$92,363
Interest Rate
6.71%
Estimated Equity
$897,754
Purchase Details
Closed on
Apr 21, 1999
Sold by
Adrover Miguel Co Tr Adrover Trust
Bought by
Berganza Daniel Dejesus and Berganza Neida Elizabeth
Home Financials for this Owner
Home Financials are based on the most recent Mortgage that was taken out on this home.
Original Mortgage
$143,840
Interest Rate
6.87%
Create a Home Valuation Report for This Property
The Home Valuation Report is an in-depth analysis detailing your home's value as well as a comparison with similar homes in the area
Home Values in the Area
Average Home Value in this Area
Purchase History
| Date | Buyer | Sale Price | Title Company |
|---|---|---|---|
| The Alfredo Berrera Living Trust | -- | None Available | |
| Barrera Alfredo | $275,000 | Equity Title | |
| Berganza Daniel Dejesus | $180,000 | First American Title Co |
Source: Public Records
Mortgage History
| Date | Status | Borrower | Loan Amount |
|---|---|---|---|
| Open | Barrera Alfredo | $220,000 | |
| Previous Owner | Berganza Daniel Dejesus | $143,840 |
Source: Public Records
Tax History Compared to Growth
Tax History
| Year | Tax Paid | Tax Assessment Tax Assessment Total Assessment is a certain percentage of the fair market value that is determined by local assessors to be the total taxable value of land and additions on the property. | Land | Improvement |
|---|---|---|---|---|
| 2025 | $5,135 | $398,267 | $275,172 | $123,095 |
| 2024 | $5,135 | $390,459 | $269,777 | $120,682 |
| 2023 | $5,042 | $382,804 | $264,488 | $118,316 |
| 2022 | $4,817 | $375,299 | $259,302 | $115,997 |
| 2021 | $4,746 | $367,941 | $254,218 | $113,723 |
| 2019 | $4,610 | $357,029 | $246,679 | $110,350 |
| 2018 | $4,499 | $350,030 | $241,843 | $108,187 |
| 2016 | $4,276 | $336,439 | $232,452 | $103,987 |
| 2015 | $4,217 | $331,387 | $228,961 | $102,426 |
| 2014 | $4,221 | $324,896 | $224,476 | $100,420 |
Source: Public Records
Map
Nearby Homes
- 233 W Oliver St
- 335 N Palos Verdes St
- 349 W Amar St
- 373 W Santa Cruz St
- 302 N Pacific Ave
- 548 Bonita St
- 586 W 1st St
- 584 W 3rd St
- 622 W 2nd St
- 586 W Macarthur Ave
- 663 W 2nd St
- 285 W 6th St Unit 527
- 285 W 6th St Unit 327
- 285 W 6th St Unit 317
- 681 W Upland Ave
- 745 W Oliver St
- 528 530 W 19th St
- 1233 1235 W 24th St
- 952 N Gaffey Place
- 631 W 6th St
- 323 W Ofarrell St
- 339 W Ofarrell St
- 347 W Ofarrell St
- 353 W Ofarrell St
- 327 N Centre St
- 341 N Centre St
- 334 W Sepulveda St
- 323 N Centre St
- 340 W Sepulveda St
- 324 W Sepulveda St
- 359 W Ofarrell St
- 325 N Centre St
- 346 W Sepulveda St
- 317 N Centre St
- 334 W Ofarrell St
- 328 W Ofarrell St
- 354 W Sepulveda St
- 344 W Ofarrell St
- 322 W Ofarrell St
- 365 W Ofarrell St