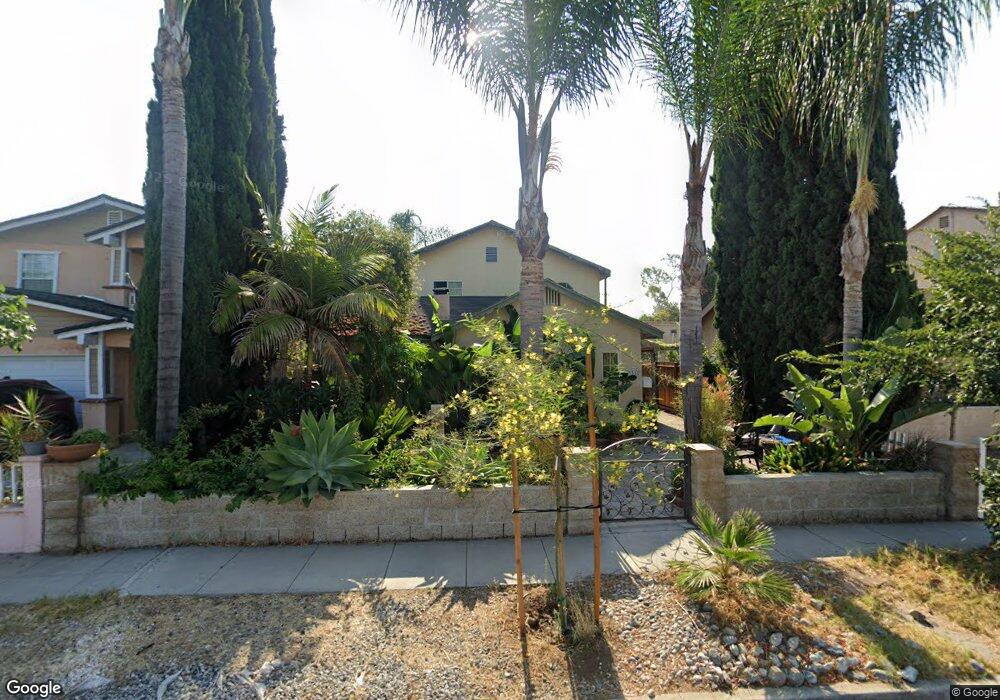
3312 Myrtle Ave Signal Hill, CA 90755
Estimated Value: $868,000 - $1,163,769
3
Beds
3
Baths
2,369
Sq Ft
$441/Sq Ft
Est. Value
About This Home
This home is located at 3312 Myrtle Ave, Signal Hill, CA 90755 and is currently estimated at $1,045,442, approximately $441 per square foot. 3312 Myrtle Ave is a home located in Los Angeles County with nearby schools including Signal Hill Elementary School, Hughes Middle School, and Long Beach Polytechnic High School.
Ownership History
Date
Name
Owned For
Owner Type
Purchase Details
Closed on
Dec 8, 2001
Sold by
Hud
Bought by
Teuk Reaksmey Sherry
Current Estimated Value
Home Financials for this Owner
Home Financials are based on the most recent Mortgage that was taken out on this home.
Original Mortgage
$172,400
Outstanding Balance
$68,166
Interest Rate
6.73%
Estimated Equity
$977,276
Purchase Details
Closed on
May 31, 2001
Sold by
Homeside Lending Inc
Bought by
Hud
Purchase Details
Closed on
Jan 30, 2001
Sold by
Gonzalez Linda
Bought by
Homeside Lending Inc
Purchase Details
Closed on
Jun 17, 1998
Sold by
Griffin Larry L
Bought by
Gonzalez Linda
Home Financials for this Owner
Home Financials are based on the most recent Mortgage that was taken out on this home.
Original Mortgage
$139,520
Interest Rate
7.17%
Mortgage Type
FHA
Purchase Details
Closed on
Mar 20, 1997
Sold by
Creswell Virginia G
Bought by
The Virginia Grace Creswell Trust
Create a Home Valuation Report for This Property
The Home Valuation Report is an in-depth analysis detailing your home's value as well as a comparison with similar homes in the area
Home Values in the Area
Average Home Value in this Area
Purchase History
| Date | Buyer | Sale Price | Title Company |
|---|---|---|---|
| Teuk Reaksmey Sherry | $181,500 | North American Title Co | |
| Hud | $159,573 | -- | |
| Homeside Lending Inc | $159,573 | Fidelity Title | |
| Gonzalez Linda | $141,500 | Commonwealth Title | |
| The Virginia Grace Creswell Trust | -- | -- |
Source: Public Records
Mortgage History
| Date | Status | Borrower | Loan Amount |
|---|---|---|---|
| Open | Teuk Reaksmey Sherry | $172,400 | |
| Previous Owner | Gonzalez Linda | $139,520 |
Source: Public Records
Tax History Compared to Growth
Tax History
| Year | Tax Paid | Tax Assessment Tax Assessment Total Assessment is a certain percentage of the fair market value that is determined by local assessors to be the total taxable value of land and additions on the property. | Land | Improvement |
|---|---|---|---|---|
| 2025 | $6,678 | $494,435 | $214,494 | $279,941 |
| 2024 | $6,678 | $484,741 | $210,289 | $274,452 |
| 2023 | $6,569 | $475,237 | $206,166 | $269,071 |
| 2022 | $6,182 | $465,920 | $202,124 | $263,796 |
| 2021 | $6,054 | $456,785 | $198,161 | $258,624 |
| 2019 | $5,967 | $443,239 | $192,285 | $250,954 |
| 2018 | $5,767 | $434,549 | $188,515 | $246,034 |
| 2016 | $5,311 | $417,677 | $181,196 | $236,481 |
| 2015 | $5,111 | $411,404 | $178,475 | $232,929 |
| 2014 | $5,079 | $403,346 | $174,979 | $228,367 |
Source: Public Records
Map
Nearby Homes
- 3369 California Ave
- 3368 Linden Ave
- 3404 Cerritos Ave
- 3383 Pasadena Ave Unit 52
- 3390 Elm Ave Unit 2
- 3306 Elm Ave
- 3323 Pasadena Ave
- 3430 Elm Ave
- 3500 Elm Ave Unit 31
- 3565 Linden Ave Unit 255
- 3567 Brayton Ave
- 3403 Falcon Ave
- 201 E Pepper Dr
- 3246 Locust Ave
- 3560 Falcon Ave
- 235 E Eldridge St
- 3754 California Ave
- 165 E Eldridge St
- 1731 E Wardlow Rd
- 3641 Walnut Ave
- 3318 Myrtle Ave
- 3326 Myrtle Ave
- 3304 Myrtle Ave
- 3328 Myrtle Ave
- 3330 Myrtle Ave
- 3309 California Ave
- 3337 California Ave
- 3301 California Ave
- 3323 California Ave Unit 3323 House Share
- 3333 California Ave
- 3323 California Ave
- 3346 Myrtle Ave
- 3317 Myrtle Ave
- 3343 California Ave
- 3323 Myrtle Ave
- 3333 Myrtle Ave Unit 2
- 3333 Myrtle Ave
- 3349 California Ave
- 3343 Myrtle Ave Unit 45
- 3351 California Ave