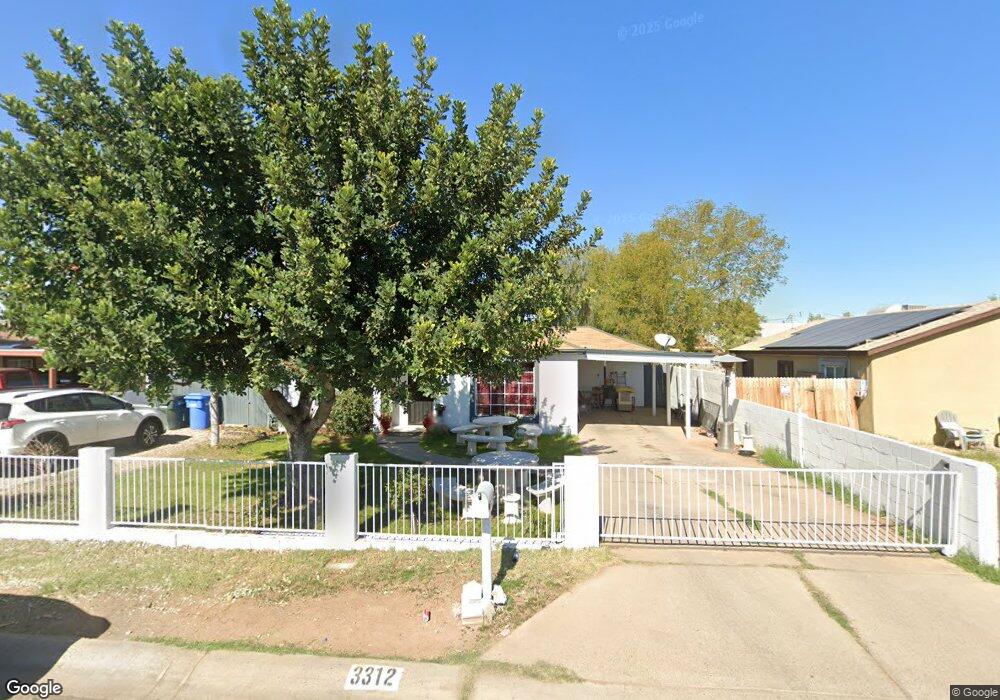
3312 W Cypress St Phoenix, AZ 85009
Maryvale NeighborhoodEstimated Value: $226,221 - $292,000
Studio
1
Bath
1,072
Sq Ft
$254/Sq Ft
Est. Value
About This Home
This home is located at 3312 W Cypress St, Phoenix, AZ 85009 and is currently estimated at $272,555, approximately $254 per square foot. 3312 W Cypress St is a home located in Maricopa County with nearby schools including P T Coe Elementary School, Isaac Middle School, and Carl Hayden High School.
Ownership History
Date
Name
Owned For
Owner Type
Purchase Details
Closed on
Apr 19, 2001
Sold by
Hatzopoulos Cheryl
Bought by
Torres Oscar Munoz
Current Estimated Value
Purchase Details
Closed on
Apr 17, 2001
Sold by
Munoz Manuela
Bought by
Torres Oscar Munoz
Purchase Details
Closed on
Nov 6, 2000
Sold by
Wiedmaier Paul D and Wiedmaier Carrie
Bought by
Hatzopoulos Cheryl
Purchase Details
Closed on
May 15, 2000
Sold by
Smith John C
Bought by
Wiedmaier Paul David and Wiedmaier Carrie
Purchase Details
Closed on
May 12, 2000
Sold by
Smith Betty Jane
Bought by
Wiedmaier Paul David and Wiedmaier Carrie
Create a Home Valuation Report for This Property
The Home Valuation Report is an in-depth analysis detailing your home's value as well as a comparison with similar homes in the area
Home Values in the Area
Average Home Value in this Area
Purchase History
| Date | Buyer | Sale Price | Title Company |
|---|---|---|---|
| Torres Oscar Munoz | $90,000 | Capital Title Agency | |
| Torres Oscar Munoz | -- | Capital Title Agency | |
| Hatzopoulos Cheryl | $55,000 | Nations Title Insurance | |
| Wiedmaier Paul David | $38,000 | North American Title Agency | |
| Wiedmaier Paul David | -- | North American Title Agency | |
| Wiedmaier Paul David | -- | North American Title Agency |
Source: Public Records
Tax History
| Year | Tax Paid | Tax Assessment Tax Assessment Total Assessment is a certain percentage of the fair market value that is determined by local assessors to be the total taxable value of land and additions on the property. | Land | Improvement |
|---|---|---|---|---|
| 2025 | $558 | $3,800 | -- | -- |
| 2024 | $550 | $3,619 | -- | -- |
| 2023 | $550 | $18,850 | $3,770 | $15,080 |
| 2022 | $522 | $13,530 | $2,700 | $10,830 |
| 2021 | $501 | $12,130 | $2,420 | $9,710 |
| 2020 | $490 | $10,360 | $2,070 | $8,290 |
| 2019 | $479 | $8,450 | $1,690 | $6,760 |
| 2018 | $508 | $7,410 | $1,480 | $5,930 |
| 2017 | $445 | $6,820 | $1,360 | $5,460 |
| 2016 | $432 | $5,080 | $1,010 | $4,070 |
| 2015 | $393 | $4,150 | $830 | $3,320 |
Source: Public Records
Map
Nearby Homes
- 3145 W Cypress St
- 3435 W Holly St
- 3528 W Encanto Blvd
- 3123 W Holly St
- 3349 W Cambridge Ave
- 3036 W Cypress St
- 3308 W Windsor Ave
- 2951 W Holly St
- 3319 W Edgemont Ave
- 3714 W Sheridan St
- 3801 W Wilshire Dr
- 1516 N 37th Ave
- 1642 N 38th Ave
- 2843 W Granada Rd
- 2001 N 39th Ave
- 3914 W Palm Ln Unit 5
- 2301 N 39th Ln
- 2026 N 27th Ave
- 3016 N 35th Dr
- 3952 W Hubbell St
- 3310 W Cypress St
- 3318 W Cypress St
- 3304 W Cypress St
- 3320 W Cypress St
- 3311 W Encanto Blvd
- 3305 W Encanto Blvd
- 3317 W Encanto Blvd
- 3324 W Cypress St
- 3313 W Cypress St
- 3301 W Encanto Blvd
- 3319 W Encanto Blvd
- 3307 W Cypress St
- 3317 W Cypress St Unit 1,2
- 3317 W Cypress St
- 3301 W Cypress St
- 3323 W Cypress St
- 3321 W Encanto Blvd
- 3328 W Cypress St Unit 14
- 3328 W Cypress St
- 3329 W Cypress St
Your Personal Tour Guide
Ask me questions while you tour the home.