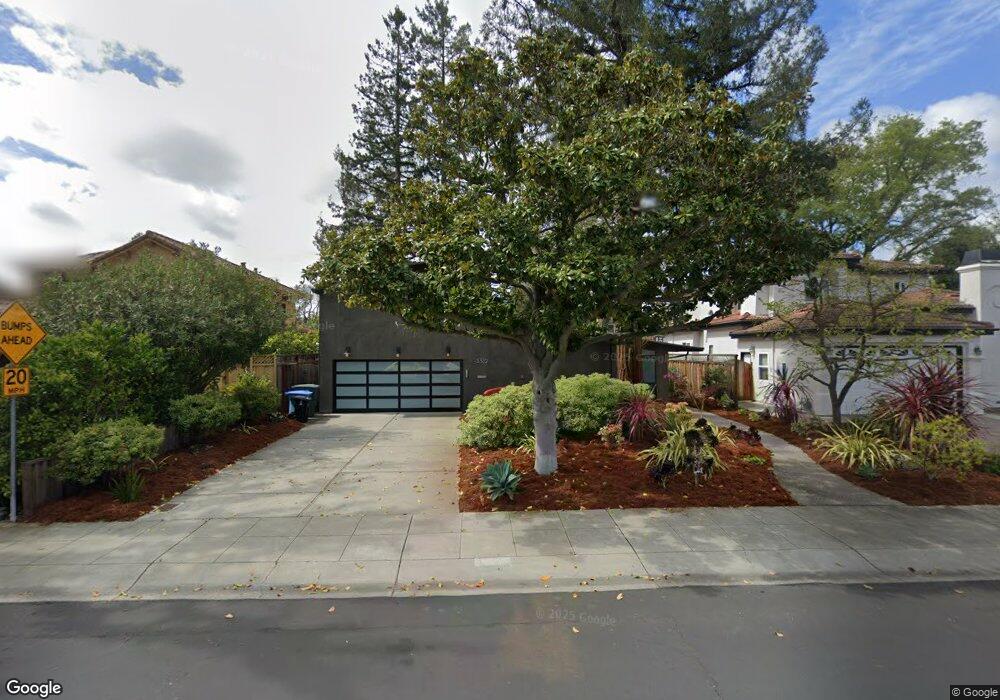
3312 Waverley St Palo Alto, CA 94306
South of Midtown NeighborhoodEstimated Value: $3,443,000 - $3,785,638
3
Beds
2
Baths
925
Sq Ft
$3,995/Sq Ft
Est. Value
About This Home
This home is located at 3312 Waverley St, Palo Alto, CA 94306 and is currently estimated at $3,695,160, approximately $3,994 per square foot. 3312 Waverley St is a home located in Santa Clara County with nearby schools including El Carmelo Elementary School, Jane Lathrop Stanford Middle School, and Henry M. Gunn High School.
Ownership History
Date
Name
Owned For
Owner Type
Purchase Details
Closed on
Jun 2, 2020
Sold by
Chan Stella Mo Lan and Chan Mo Lan
Bought by
Chan Stella Mo Lan and The Mo Lan Revocable Trust
Current Estimated Value
Home Financials for this Owner
Home Financials are based on the most recent Mortgage that was taken out on this home.
Original Mortgage
$440,000
Outstanding Balance
$309,317
Interest Rate
3.2%
Mortgage Type
New Conventional
Estimated Equity
$3,385,843
Purchase Details
Closed on
Jun 26, 2013
Sold by
Chan Mo Lan
Bought by
Chan Mo Lan
Home Financials for this Owner
Home Financials are based on the most recent Mortgage that was taken out on this home.
Original Mortgage
$655,500
Interest Rate
3.57%
Mortgage Type
New Conventional
Purchase Details
Closed on
Jan 3, 2013
Sold by
Chan Mo Lan
Bought by
Chan Mo Lan
Home Financials for this Owner
Home Financials are based on the most recent Mortgage that was taken out on this home.
Original Mortgage
$381,000
Interest Rate
3.33%
Mortgage Type
New Conventional
Purchase Details
Closed on
Nov 21, 2012
Sold by
Chan Mo Lan
Bought by
Chan Mo Lan
Home Financials for this Owner
Home Financials are based on the most recent Mortgage that was taken out on this home.
Original Mortgage
$381,000
Interest Rate
3.33%
Mortgage Type
New Conventional
Purchase Details
Closed on
Sep 23, 2010
Sold by
Chan Mo Lan
Bought by
Chan Mo Lan
Home Financials for this Owner
Home Financials are based on the most recent Mortgage that was taken out on this home.
Original Mortgage
$417,000
Interest Rate
4.35%
Mortgage Type
New Conventional
Purchase Details
Closed on
Sep 4, 2009
Sold by
Chan Mo Lan
Bought by
Chan Mo Lan
Home Financials for this Owner
Home Financials are based on the most recent Mortgage that was taken out on this home.
Original Mortgage
$956,000
Interest Rate
5.62%
Mortgage Type
New Conventional
Purchase Details
Closed on
Feb 6, 2008
Sold by
Chan Mo Lan
Bought by
Chan Mo Lan
Home Financials for this Owner
Home Financials are based on the most recent Mortgage that was taken out on this home.
Original Mortgage
$400,000
Interest Rate
6.17%
Mortgage Type
New Conventional
Purchase Details
Closed on
Mar 4, 2004
Sold by
Chan Mo Lan
Bought by
Chan Mo Lan
Purchase Details
Closed on
Jul 1, 2003
Sold by
Ng Joseph C
Bought by
Chan Mo Lan
Home Financials for this Owner
Home Financials are based on the most recent Mortgage that was taken out on this home.
Original Mortgage
$555,000
Interest Rate
5.18%
Mortgage Type
Purchase Money Mortgage
Create a Home Valuation Report for This Property
The Home Valuation Report is an in-depth analysis detailing your home's value as well as a comparison with similar homes in the area
Home Values in the Area
Average Home Value in this Area
Purchase History
| Date | Buyer | Sale Price | Title Company |
|---|---|---|---|
| Chan Stella Mo Lan | -- | Chicago Title Company | |
| Chan Mo Lan | -- | First American Title Ins Co | |
| Chan Mo Lan | -- | None Available | |
| Chan Mo Lan | -- | First American Title Insuran | |
| Chan Mo Lan | -- | Old Republic Title Company | |
| Chan Mo Lan | -- | Old Republic Title Company | |
| Chan Mo Lan | -- | Old Republic Title Company | |
| Chan Mo Lan | -- | Old Republic Title Company | |
| Chan Mo Lan | -- | Old Republic Title Company | |
| Chan Mo Lan | -- | Old Republic Title Company | |
| Chan Mo Lan | -- | -- | |
| Chan Mo Lan | -- | Financial Title Company | |
| Chan Mo Lan | $955,000 | Financial Title Company |
Source: Public Records
Mortgage History
| Date | Status | Borrower | Loan Amount |
|---|---|---|---|
| Open | Chan Stella Mo Lan | $440,000 | |
| Closed | Chan Mo Lan | $655,500 | |
| Closed | Chan Mo Lan | $381,000 | |
| Closed | Chan Mo Lan | $417,000 | |
| Closed | Chan Mo Lan | $956,000 | |
| Closed | Chan Mo Lan | $400,000 | |
| Closed | Chan Mo Lan | $555,000 |
Source: Public Records
Tax History Compared to Growth
Tax History
| Year | Tax Paid | Tax Assessment Tax Assessment Total Assessment is a certain percentage of the fair market value that is determined by local assessors to be the total taxable value of land and additions on the property. | Land | Improvement |
|---|---|---|---|---|
| 2025 | $15,682 | $1,357,794 | $678,897 | $678,897 |
| 2024 | $15,682 | $1,331,172 | $665,586 | $665,586 |
| 2023 | $16,321 | $1,305,072 | $652,536 | $652,536 |
| 2022 | $16,127 | $1,279,484 | $639,742 | $639,742 |
| 2021 | $15,807 | $1,254,398 | $627,199 | $627,199 |
| 2020 | $15,489 | $1,241,536 | $620,768 | $620,768 |
| 2019 | $15,314 | $1,217,194 | $608,597 | $608,597 |
| 2018 | $14,902 | $1,193,328 | $596,664 | $596,664 |
| 2017 | $14,639 | $1,169,930 | $584,965 | $584,965 |
| 2016 | $14,251 | $1,146,992 | $573,496 | $573,496 |
| 2015 | $14,107 | $1,129,764 | $564,882 | $564,882 |
| 2014 | $13,774 | $1,107,634 | $553,817 | $553,817 |
Source: Public Records
Map
Nearby Homes
- 339 El Verano Ave
- 590 Ashton Ave
- 3213 Alma St
- 3428 Alma Village Cir
- 701 Christine Dr
- 360 Fernando Ave
- 3585 El Camino Real
- 2760 Byron St
- 4115 El Camino Real Unit 333
- 4115 El Camino Real Unit 331
- 4115 El Camino Real Unit 222
- 4115 El Camino Real Unit 332
- 773 E Meadow Dr
- 3888 Magnolia Dr
- 883 Rorke Way
- 2685 Cowper St
- 4005 Villa Vera
- 342 Carolina Ln
- 4225 Park Blvd
- 3141 David Ct
- 3318 Waverley St
- 384 El Verano Ave
- 3322 Waverley St
- 3311 South Ct
- 3325 South Ct
- 354 El Verano Ave
- 3330 Waverley St
- 3335 South Ct
- 363 El Verano Ave
- 3315 Waverley St
- 402 El Verano Ave
- 3321 Waverley St
- 3345 South Ct
- 3338 Waverley St
- 355 El Verano Ave
- 3337 Waverley St
- 3288 Waverley St
- 3357 South Ct
- 3299 Waverley St
- 3349 Waverley St