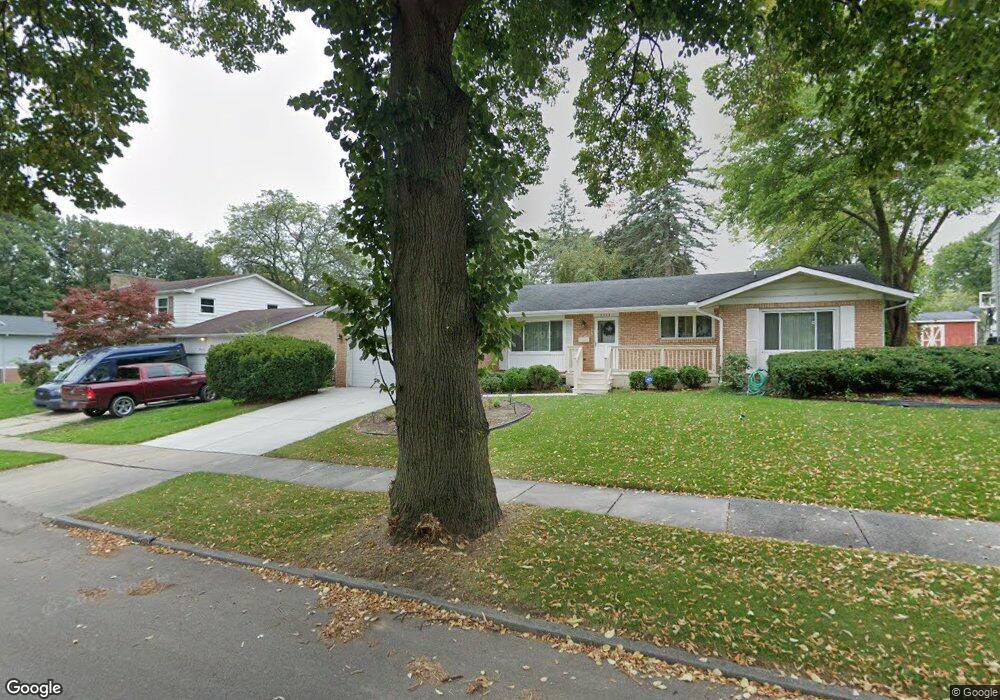
3313 Christine Dr Lansing, MI 48911
Averill Woods NeighborhoodEstimated Value: $253,000 - $288,000
4
Beds
3
Baths
1,788
Sq Ft
$149/Sq Ft
Est. Value
About This Home
This home is located at 3313 Christine Dr, Lansing, MI 48911 and is currently estimated at $266,503, approximately $149 per square foot. 3313 Christine Dr is a home located in Ingham County with nearby schools including Averill Elementary School, Attwood School, and J.W. Sexton High School.
Ownership History
Date
Name
Owned For
Owner Type
Purchase Details
Closed on
Aug 13, 2013
Sold by
Gully Bonnie L
Bought by
Gully Carmichael
Current Estimated Value
Purchase Details
Closed on
Aug 12, 2013
Sold by
Gully Bonnie L
Bought by
Gully Carmichael
Purchase Details
Closed on
Apr 13, 2010
Sold by
Gully Carmichael and Gully Bonnie L
Bought by
Gully Carmichael and Gully Bonnie L
Purchase Details
Closed on
May 22, 2009
Sold by
Capatanos Dolores M
Bought by
Gully Carmichael
Home Financials for this Owner
Home Financials are based on the most recent Mortgage that was taken out on this home.
Original Mortgage
$125,000
Interest Rate
4.94%
Mortgage Type
VA
Purchase Details
Closed on
May 22, 2006
Sold by
Capatanos Dolores M and Capatanos Louis N
Bought by
Capatanos Dolores M and Dolores M Capatanos Trust
Create a Home Valuation Report for This Property
The Home Valuation Report is an in-depth analysis detailing your home's value as well as a comparison with similar homes in the area
Home Values in the Area
Average Home Value in this Area
Purchase History
| Date | Buyer | Sale Price | Title Company |
|---|---|---|---|
| Gully Carmichael | -- | None Available | |
| Gully Carmichael | -- | None Available | |
| Gully Carmichael | -- | None Available | |
| Gully Carmichael | $125,000 | None Available | |
| Capatanos Dolores M | -- | None Available |
Source: Public Records
Mortgage History
| Date | Status | Borrower | Loan Amount |
|---|---|---|---|
| Previous Owner | Gully Carmichael | $125,000 |
Source: Public Records
Tax History Compared to Growth
Tax History
| Year | Tax Paid | Tax Assessment Tax Assessment Total Assessment is a certain percentage of the fair market value that is determined by local assessors to be the total taxable value of land and additions on the property. | Land | Improvement |
|---|---|---|---|---|
| 2025 | $125 | $123,100 | $15,400 | $107,700 |
| 2024 | $33 | $107,500 | $15,400 | $92,100 |
| 2023 | $122 | $99,300 | $15,400 | $83,900 |
| 2022 | $119 | $0 | $0 | $0 |
| 2021 | $117 | $77,900 | $13,200 | $64,700 |
| 2020 | $2,819 | $77,900 | $13,200 | $64,700 |
| 2019 | $3,063 | $0 | $0 | $0 |
| 2018 | $3,063 | $0 | $13,200 | $49,500 |
| 2017 | $95 | $62,700 | $13,200 | $49,500 |
| 2016 | $2,360 | $55,300 | $13,200 | $42,100 |
| 2015 | $2,360 | $26,328 | $26,328 | $0 |
| 2014 | $2,360 | $50,500 | $26,328 | $24,172 |
Source: Public Records
Map
Nearby Homes
- 3214 Gingersnap Ln
- 2838 Sunderland Rd
- 3510 Christine Dr
- 3425 Cooley Dr
- 2710 Bedford Rd
- 3421 Troon Cir Unit 29
- 3600 Sandhurst Dr
- 3614 Cooley Dr
- 2905 S Catherine St
- 3508 Muirfield Dr
- 3601 Muirfield Dr
- 3811 Cooley Dr
- 4.5 Locust Ln
- 3200 Lawdor Rd
- 2201 Pamela Place
- 2200 Rossiter Place
- 2 Locust Ln
- 3310 W Mount Hope Ave
- 0 S Deerfield Ave
- 2800 S Waverly Hwy
- 3319 Christine Dr
- 3307 Christine Dr
- 3312 Inverary Dr
- 3306 Inverary Dr
- 3327 Christine Dr
- 3233 Christine Dr
- 3320 Inverary Dr
- 3236 Inverary Dr
- 3312 Christine Dr
- 3318 Christine Dr
- 3306 Christine Dr
- 3333 Christine Dr
- 3328 Inverary Dr
- 2614 Oban Rd
- 3227 Christine Dr
- 3228 Inverary Dr
- 3332 Christine Dr
- 3339 Christine Dr
- 3336 Inverary Dr