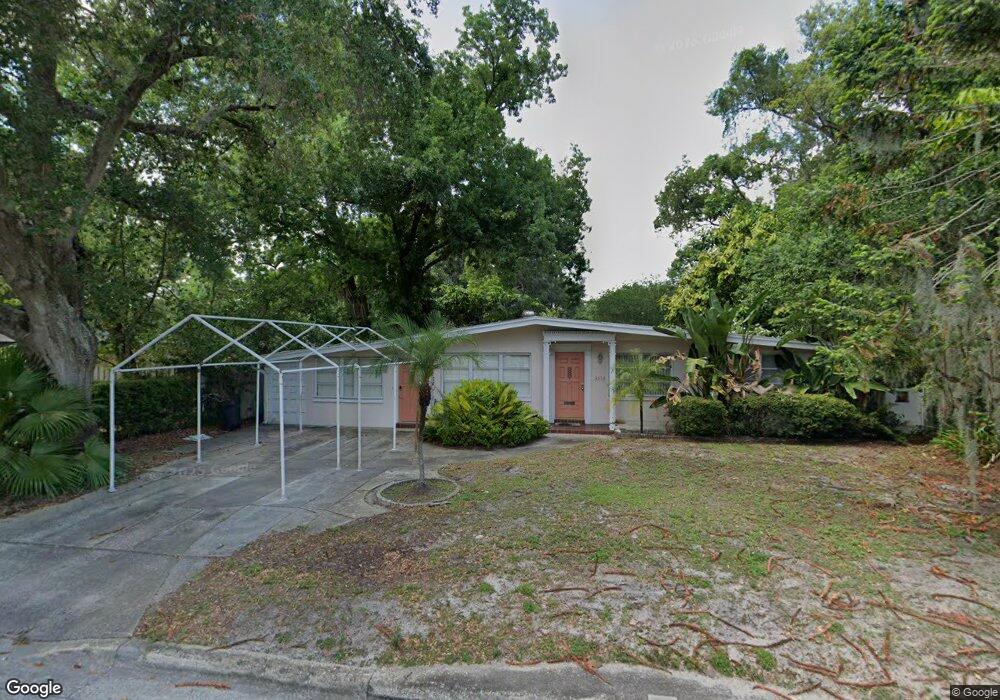
3313 Corrine Dr Orlando, FL 32803
Estimated Value: $476,000 - $555,000
2
Beds
1
Bath
1,190
Sq Ft
$435/Sq Ft
Est. Value
About This Home
This home is located at 3313 Corrine Dr, Orlando, FL 32803 and is currently estimated at $517,312, approximately $434 per square foot. 3313 Corrine Dr is a home located in Orange County with nearby schools including Audubon Park School, Winter Park High, and Central Florida Leadership Academy Charter.
Ownership History
Date
Name
Owned For
Owner Type
Purchase Details
Closed on
Aug 13, 2019
Sold by
Albertson Brian
Bought by
3217 Corrine Llc
Current Estimated Value
Home Financials for this Owner
Home Financials are based on the most recent Mortgage that was taken out on this home.
Original Mortgage
$183,400
Interest Rate
3.7%
Mortgage Type
Commercial
Purchase Details
Closed on
Jul 15, 2019
Sold by
Fisher Douglas A and Fisher Timothy
Bought by
Albertson Brian
Home Financials for this Owner
Home Financials are based on the most recent Mortgage that was taken out on this home.
Original Mortgage
$183,400
Interest Rate
3.7%
Mortgage Type
Commercial
Purchase Details
Closed on
Jan 20, 1999
Sold by
Imbesi Denise C and Barbalock Cindy A
Bought by
Barbalock Cynthia A
Home Financials for this Owner
Home Financials are based on the most recent Mortgage that was taken out on this home.
Original Mortgage
$93,750
Interest Rate
6.71%
Mortgage Type
New Conventional
Create a Home Valuation Report for This Property
The Home Valuation Report is an in-depth analysis detailing your home's value as well as a comparison with similar homes in the area
Home Values in the Area
Average Home Value in this Area
Purchase History
| Date | Buyer | Sale Price | Title Company |
|---|---|---|---|
| 3217 Corrine Llc | -- | Integrity First Title Llc | |
| Albertson Brian | $350,000 | Integrity First Title | |
| Barbalock Cynthia A | $46,900 | -- |
Source: Public Records
Mortgage History
| Date | Status | Borrower | Loan Amount |
|---|---|---|---|
| Closed | 3217 Corrine Llc | $183,400 | |
| Previous Owner | Barbalock Cynthia A | $20,000 | |
| Previous Owner | Barbalock Cynthia A | $93,750 |
Source: Public Records
Tax History Compared to Growth
Tax History
| Year | Tax Paid | Tax Assessment Tax Assessment Total Assessment is a certain percentage of the fair market value that is determined by local assessors to be the total taxable value of land and additions on the property. | Land | Improvement |
|---|---|---|---|---|
| 2025 | $5,824 | $402,260 | $200,000 | $202,260 |
| 2024 | $5,634 | $392,670 | $200,000 | $192,670 |
| 2023 | $5,634 | $361,284 | $200,000 | $161,284 |
| 2022 | $5,162 | $337,181 | $200,000 | $137,181 |
| 2021 | $5,022 | $301,739 | $180,000 | $121,739 |
| 2020 | $4,890 | $304,158 | $180,000 | $124,158 |
| 2019 | $3,879 | $225,130 | $160,000 | $65,130 |
| 2018 | $389 | $77,630 | $0 | $0 |
| 2017 | $717 | $138,684 | $84,500 | $54,184 |
| 2016 | $698 | $135,242 | $82,000 | $53,242 |
| 2015 | $714 | $127,265 | $75,000 | $52,265 |
| 2014 | $757 | $129,080 | $92,000 | $37,080 |
Source: Public Records
Map
Nearby Homes
- 3025 Northwood Blvd
- 2812 Mulford Ave
- 3018 Northwood Blvd
- 2825 Mulford Ave
- 2128 Sycamore Dr
- 1616 Oriole Ave
- 3704 Lower Union Rd
- 3626 Bobolink Ln
- 3632 Upper Union Rd
- 2098 Osprey Ave
- 3838 Haws Ln
- 2905 Parkland Dr
- 2260 Mulbry Dr
- 3929 Corrine Dr
- 2604 Marble Ave
- 4001 Corrine Dr
- 2823 Wright Ave
- 2614 Parkland Dr
- 1201 Tanager Dr
- 1901 Lake Sue Dr
- 3319 Corrine Dr
- 3303 Corrine Dr
- 1813 Northwood Terrace
- 2836 Northwood Blvd
- 3401 Corrine Dr
- 2842 Northwood Blvd
- 1819 Northwood Terrace
- 1725 Oriole Ave
- 1726 Cardinal Rd
- 2818 Northwood Dr
- 2848 Northwood Blvd
- 3407 Corrine Dr
- 1719 Oriole Ave
- 1720 Cardinal Rd
- 2904 Northwood Blvd
- 1812 Northwood Terrace
- 1725 Cardinal Rd
- 3413 Corrine Dr
- 1818 Northwood Terrace