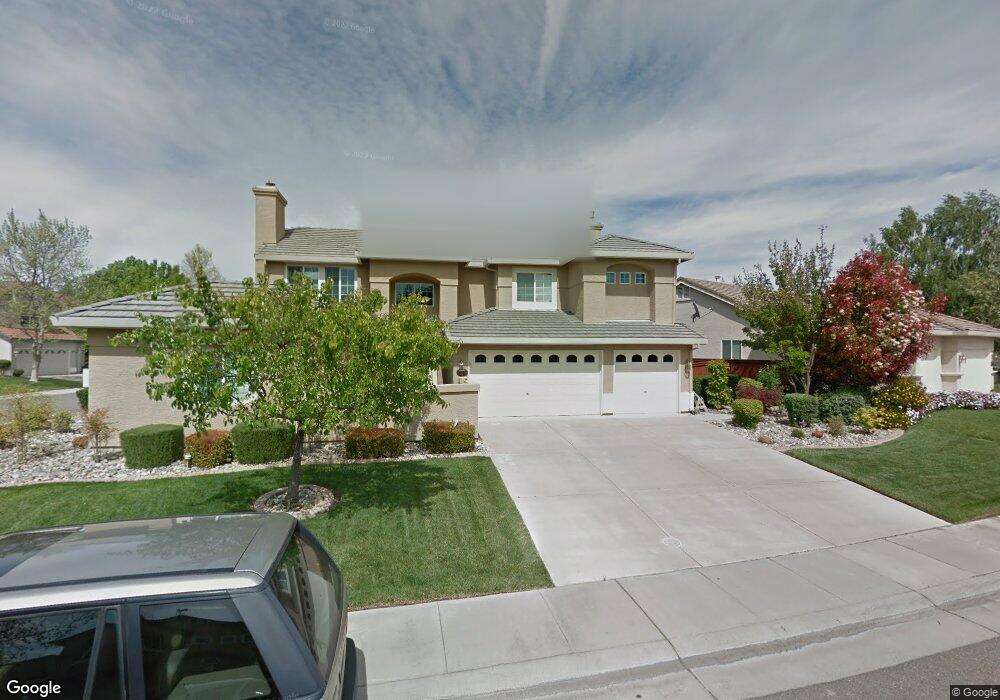
3313 Lakeland Way Elk Grove, CA 95758
North West Elk Grove NeighborhoodEstimated Value: $456,000 - $839,000
4
Beds
3
Baths
2,266
Sq Ft
$309/Sq Ft
Est. Value
About This Home
This home is located at 3313 Lakeland Way, Elk Grove, CA 95758 and is currently estimated at $700,672, approximately $309 per square foot. 3313 Lakeland Way is a home located in Sacramento County with nearby schools including Stone Lake Elementary, Toby Johnson Middle School, and Franklin High School.
Ownership History
Date
Name
Owned For
Owner Type
Purchase Details
Closed on
Jul 6, 2015
Sold by
Gates James H and Garcia Gates Sheree P
Bought by
Garcia Sheree P
Current Estimated Value
Purchase Details
Closed on
Feb 19, 2015
Sold by
Garcia Sheree P and Garcia Gates Sheree P
Bought by
Gates James H and Garcia Gates Sheree P
Purchase Details
Closed on
Aug 30, 2001
Sold by
Head Stephen and Head Melinda
Bought by
Garcia Sheree P
Home Financials for this Owner
Home Financials are based on the most recent Mortgage that was taken out on this home.
Original Mortgage
$293,250
Outstanding Balance
$140,807
Interest Rate
10.24%
Estimated Equity
$559,865
Purchase Details
Closed on
Sep 11, 1998
Sold by
Bridgeport Cove Partners Ltd
Bought by
Head Stephen and Head Melinda
Home Financials for this Owner
Home Financials are based on the most recent Mortgage that was taken out on this home.
Original Mortgage
$190,550
Interest Rate
6.89%
Create a Home Valuation Report for This Property
The Home Valuation Report is an in-depth analysis detailing your home's value as well as a comparison with similar homes in the area
Home Values in the Area
Average Home Value in this Area
Purchase History
| Date | Buyer | Sale Price | Title Company |
|---|---|---|---|
| Garcia Sheree P | -- | None Available | |
| Gates James H | -- | None Available | |
| Garcia Sheree P | $345,000 | Chicago Title Co | |
| Head Stephen | $238,500 | Placer Title Company |
Source: Public Records
Mortgage History
| Date | Status | Borrower | Loan Amount |
|---|---|---|---|
| Open | Garcia Sheree P | $293,250 | |
| Previous Owner | Head Stephen | $190,550 | |
| Closed | Head Stephen | $35,700 | |
| Closed | Garcia Sheree P | $51,750 |
Source: Public Records
Tax History Compared to Growth
Tax History
| Year | Tax Paid | Tax Assessment Tax Assessment Total Assessment is a certain percentage of the fair market value that is determined by local assessors to be the total taxable value of land and additions on the property. | Land | Improvement |
|---|---|---|---|---|
| 2025 | $8,320 | $509,647 | $88,625 | $421,022 |
| 2024 | $8,320 | $499,655 | $86,888 | $412,767 |
| 2023 | $8,795 | $489,859 | $85,185 | $404,674 |
| 2022 | $8,697 | $480,255 | $83,515 | $396,740 |
| 2021 | $8,266 | $470,839 | $81,878 | $388,961 |
| 2020 | $7,829 | $466,012 | $81,039 | $384,973 |
| 2019 | $8,907 | $456,875 | $79,450 | $377,425 |
| 2018 | $8,113 | $447,918 | $77,893 | $370,025 |
| 2017 | $7,927 | $439,136 | $76,366 | $362,770 |
| 2016 | $7,625 | $430,526 | $74,869 | $355,657 |
| 2015 | $7,619 | $424,060 | $73,745 | $350,315 |
| 2014 | $7,725 | $415,754 | $72,301 | $343,453 |
Source: Public Records
Map
Nearby Homes
- 3403 Lakeland Way
- 3430 Sierra Meadow Ct
- 9608 Crystal Bay Ln
- 3619 Lake Terrace Dr
- 3112 W Sondiesa Ct
- 3516 Grimshaw Way
- 3016 W Sondiesa Ct
- 9424 Windrunner Ln
- 2720 Robinson Creek Ln Unit L
- 2891 Brighton Beach Way
- 3005 Turnbuckle Cir
- 3401 W Island Ct
- 9567 Diamond Point Ln
- 9387 Bennoel Way
- 3810 Benedix Way
- 2613 Emerald Bay Ln
- 9588 Castlecave Ct
- 9349 Edisto Way
- 4410 Bantam Way
- 4414 Bantam Way
- 3317 Lakeland Way
- 3448 Marsh Creek Way
- 3443 Marsh Creek Way
- 3447 Marsh Creek Way
- 3439 Marsh Creek Way
- 3316 Lakeland Way
- 3312 Lakeland Way
- 3452 Marsh Creek Way
- 3320 Lakeland Way
- 3451 Marsh Creek Way
- 3435 Marsh Creek Way
- 3407 Lakeland Way
- 3455 Marsh Creek Way
- 3456 Marsh Creek Way
- 3304 Lake Terrace Dr
- 3308 Lake Terrace Dr
- 3406 Sierra Meadow Ct
- 3404 Lakeland Way
- 3431 Marsh Creek Way
- 3312 Lake Terrace Dr