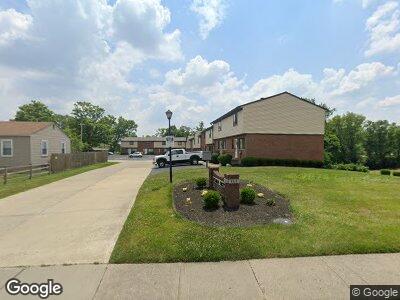
3313 North Bend Rd Cincinnati, OH 45239
East Monfort Heights NeighborhoodEstimated Value: $135,836 - $145,000
2
Beds
2
Baths
1,083
Sq Ft
$130/Sq Ft
Est. Value
About This Home
This home is located at 3313 North Bend Rd, Cincinnati, OH 45239 and is currently estimated at $140,959, approximately $130 per square foot. 3313 North Bend Rd is a home located in Hamilton County with nearby schools including Monfort Heights Elementary School, White Oak Middle School, and Colerain High School.
Ownership History
Date
Name
Owned For
Owner Type
Purchase Details
Closed on
Oct 11, 2019
Sold by
Auel Ronald F
Bought by
Auel Betty L
Current Estimated Value
Purchase Details
Closed on
Jun 7, 2016
Sold by
Nicolaci Ann N
Bought by
Auel Ronald F
Purchase Details
Closed on
Dec 1, 1992
Sold by
Schuld Teresa M
Bought by
Nicolaci Ann N
Create a Home Valuation Report for This Property
The Home Valuation Report is an in-depth analysis detailing your home's value as well as a comparison with similar homes in the area
Home Values in the Area
Average Home Value in this Area
Purchase History
| Date | Buyer | Sale Price | Title Company |
|---|---|---|---|
| Auel Betty L | -- | None Available | |
| Auel Ronald F | $45,000 | -- | |
| Nicolaci Ann N | $64,000 | -- |
Source: Public Records
Mortgage History
| Date | Status | Borrower | Loan Amount |
|---|---|---|---|
| Previous Owner | Nicolaci Ann N | $96,900 | |
| Previous Owner | Nicolaci Ann | $75,000 | |
| Previous Owner | Nicolaci Ann | $36,690 | |
| Previous Owner | Nicolaci Ann N | $15,000 | |
| Previous Owner | Nicolaci Ann N | $50,000 | |
| Previous Owner | Nicolaci Ann N | $29,400 |
Source: Public Records
Tax History Compared to Growth
Tax History
| Year | Tax Paid | Tax Assessment Tax Assessment Total Assessment is a certain percentage of the fair market value that is determined by local assessors to be the total taxable value of land and additions on the property. | Land | Improvement |
|---|---|---|---|---|
| 2024 | $1,832 | $34,517 | $6,370 | $28,147 |
| 2023 | $1,841 | $34,517 | $6,370 | $28,147 |
| 2022 | $1,092 | $16,695 | $4,823 | $11,872 |
| 2021 | $1,002 | $16,695 | $4,823 | $11,872 |
| 2020 | $1,012 | $16,695 | $4,823 | $11,872 |
| 2019 | $1,053 | $15,750 | $4,550 | $11,200 |
| 2018 | $938 | $15,750 | $4,550 | $11,200 |
| 2017 | $887 | $15,750 | $4,550 | $11,200 |
| 2016 | $1,048 | $27,405 | $4,550 | $22,855 |
| 2015 | $1,065 | $27,405 | $4,550 | $22,855 |
| 2014 | $1,067 | $27,405 | $4,550 | $22,855 |
| 2013 | $998 | $27,405 | $4,550 | $22,855 |
Source: Public Records
Map
Nearby Homes
- 3314 N Bend Rd
- 3375 Palmhill Ln
- 3380 N Bend Rd
- 5441 Philloret Dr
- 3351 Palmhill Ln
- 5682 Lauderdale Dr
- 3072 N Bend Rd
- 5748 Saint James Place
- 5782 Kroegermount Dr
- 5787 Kroegermount Dr
- 5440 Asbury Lake Dr
- 5761 Cheviot Rd
- 5838 Seiler Dr
- 5483 Asbury Lake Dr
- 5765 Cheviot Rd
- 5344 Orchardvalley Dr
- 3227 Floridale Ln
- 5610 Nickview Dr
- 5491 Asbury Lake Dr
- 5241 Orchardridge Ct
- 3313 North Bend Rd
- 3313 North Bend Rd
- 3313 North Bend Rd
- 3313 North Bend Rd
- 3313 North Bend Rd
- 3313 North Bend Rd
- 3313 North Bend Rd
- 3313 North Bend Rd
- 3313 North Bend Rd
- 3313 North Bend Rd
- 3313 North Bend Rd
- 3313 North Bend Rd
- 3313 North Bend Rd
- 3313 North Bend Rd
- 3313 North Bend Rd Unit N
- 3313 North Bend Unit A
- 3313 N Bend Rd Unit 3
- 3313 N Bend Rd Unit N
- 3313 N Bend Rd Unit H
- 3313 N Bend Rd Unit 5