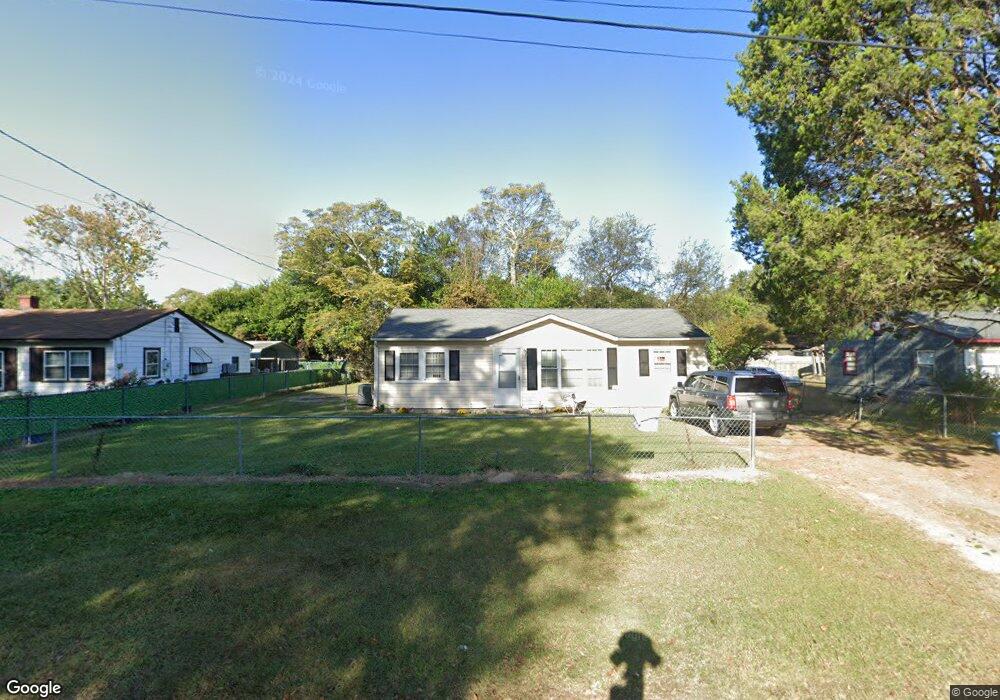
3313 Odom Rd Augusta, GA 30906
Old Savannah NeighborhoodEstimated Value: $84,914 - $94,000
2
Beds
1
Bath
936
Sq Ft
$95/Sq Ft
Est. Value
About This Home
This home is located at 3313 Odom Rd, Augusta, GA 30906 and is currently estimated at $88,729, approximately $94 per square foot. 3313 Odom Rd is a home located in Richmond County with nearby schools including Richmond Hill K-8, Johnson Magnet, and Butler High School.
Ownership History
Date
Name
Owned For
Owner Type
Purchase Details
Closed on
Sep 3, 2021
Sold by
Dunagan Donald
Bought by
Dunagan Rentals 1 Llc
Current Estimated Value
Purchase Details
Closed on
Dec 29, 2017
Sold by
Belfair Investments Co Llc
Bought by
Dunagan Donald
Purchase Details
Closed on
Nov 1, 2016
Sold by
Walter
Bought by
Belfair Investments Co Llc
Purchase Details
Closed on
Aug 27, 2010
Sold by
Belfair Investment Co Llc
Bought by
Stokes Walter D
Home Financials for this Owner
Home Financials are based on the most recent Mortgage that was taken out on this home.
Original Mortgage
$40,885
Interest Rate
4.59%
Purchase Details
Closed on
Jan 21, 2010
Sold by
Hurley Suzanne K
Bought by
Belfair Investment Co Llc
Purchase Details
Closed on
Oct 15, 2009
Sold by
Sherrod Suzanne
Bought by
Hurley Suzanne K
Purchase Details
Closed on
Nov 4, 1994
Sold by
Koone James M
Bought by
Sherrod Suzanne
Purchase Details
Closed on
Oct 31, 1994
Sold by
Koone James M
Bought by
Sherrod Suzanne
Purchase Details
Closed on
Jul 19, 1988
Sold by
Bowles Cheryl Allene Sherrod Suzanne
Bought by
Koone James Middleton
Create a Home Valuation Report for This Property
The Home Valuation Report is an in-depth analysis detailing your home's value as well as a comparison with similar homes in the area
Home Values in the Area
Average Home Value in this Area
Purchase History
We collect this data history from publicly available records. To have your information removed, we recommend requesting removal directly through your county’s website.
| Date | Buyer | Sale Price | Title Company |
|---|---|---|---|
| Dunagan Rentals 1 Llc | -- | -- | |
| Dunagan Donald | $20,000 | -- | |
| Belfair Investments Co Llc | -- | -- | |
| Stokes Walter D | $43,100 | -- | |
| Stokes Walter D | $43,000 | -- | |
| Belfair Investment Co Llc | -- | -- | |
| Belfair Investment Co Llc | -- | -- | |
| Hurley Suzanne K | -- | -- | |
| Sherrod Suzanne | -- | -- | |
| Sherrod Suzanne | -- | -- | |
| Koone James Middleton | -- | -- |
Source: Public Records
Mortgage History
We collect this data history from publicly available records. To have your information removed, we recommend requesting removal directly through your county’s website.
| Date | Status | Borrower | Loan Amount |
|---|---|---|---|
| Previous Owner | Stokes Walter D | $40,885 |
Source: Public Records
Tax History
| Year | Tax Paid | Tax Assessment Tax Assessment Total Assessment is a certain percentage of the fair market value that is determined by local assessors to be the total taxable value of land and additions on the property. | Land | Improvement |
|---|---|---|---|---|
| 2025 | $1,500 | $31,508 | $3,400 | $28,108 |
| 2024 | $1,500 | $31,660 | $3,400 | $28,260 |
| 2023 | $1,251 | $27,284 | $3,400 | $23,884 |
| 2022 | $1,027 | $22,565 | $3,400 | $19,165 |
| 2021 | $886 | $15,952 | $3,400 | $12,552 |
| 2020 | $877 | $15,952 | $3,400 | $12,552 |
| 2019 | $912 | $15,952 | $3,400 | $12,552 |
| 2018 | $916 | $15,952 | $3,400 | $12,552 |
| 2017 | $857 | $15,952 | $3,400 | $12,552 |
| 2016 | $696 | $15,952 | $3,400 | $12,552 |
| 2015 | $699 | $15,952 | $3,400 | $12,552 |
| 2014 | $699 | $15,952 | $3,400 | $12,552 |
Source: Public Records
Map
Nearby Homes
- 1919 Moore Rd
- 104 Thomas Cir
- 3206 Rhonda Dr
- 3211 Rhonda Dr
- 1915 Preston Dr
- 3214 Sylvester Dr
- 3113 Bell Dr
- 3108 Wilbur St
- 3330 Fashion Dr
- 1809 Formosa Dr
- 3307 Jonathan Cir
- 3341 Fashion Dr
- 3320 Emerson Dr
- 3312 Jonathan Cir
- 2522 Argonne Dr
- 1831 Catalina Dr
- 1926 Dunham Ct
- 1909 Melrose Dr
- 3420 Applejack Terrace
- 2617 Blueberry Dr
Your Personal Tour Guide
Ask me questions while you tour the home.