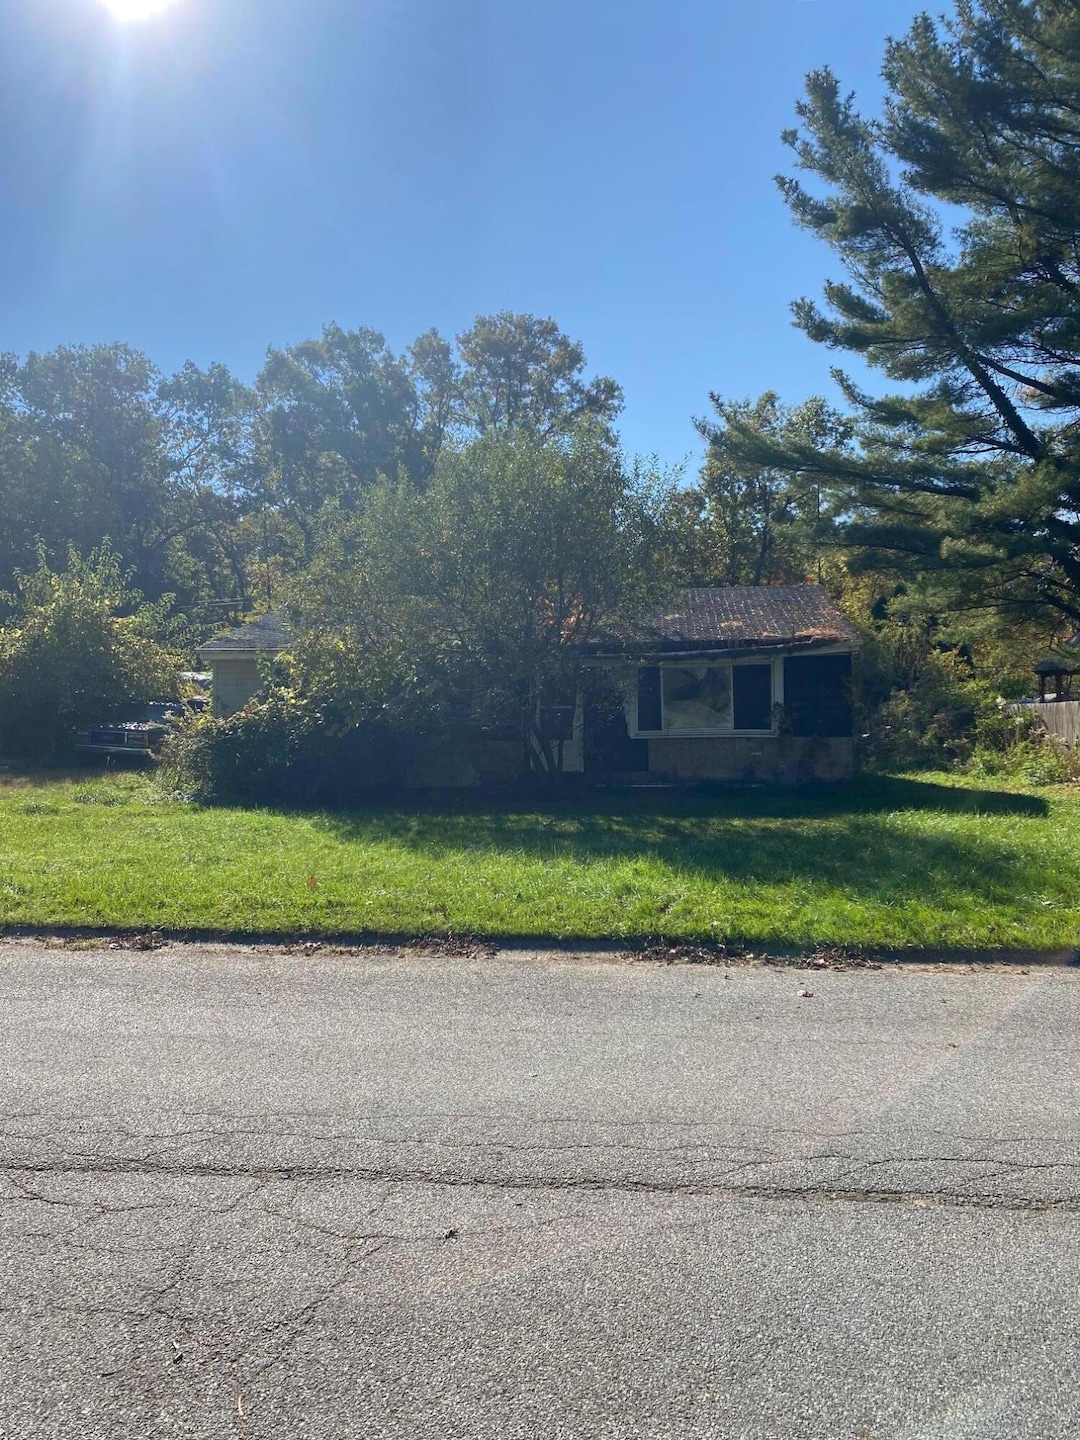
3313 W 51st Place Gary, IN 46408
Ross NeighborhoodEstimated payment $333/month
Highlights
- No HOA
- Living Room
- 1-Story Property
- Views
About This Home
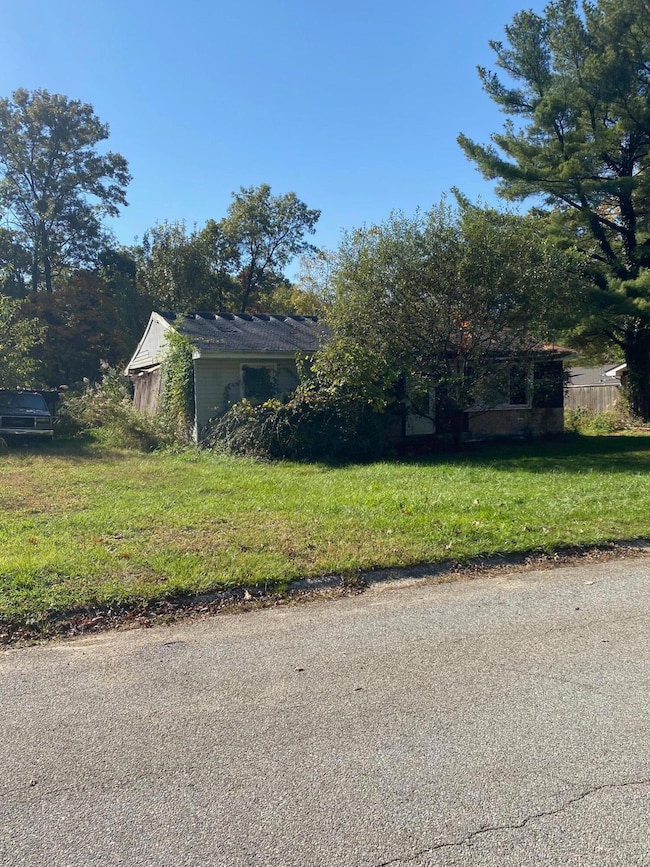
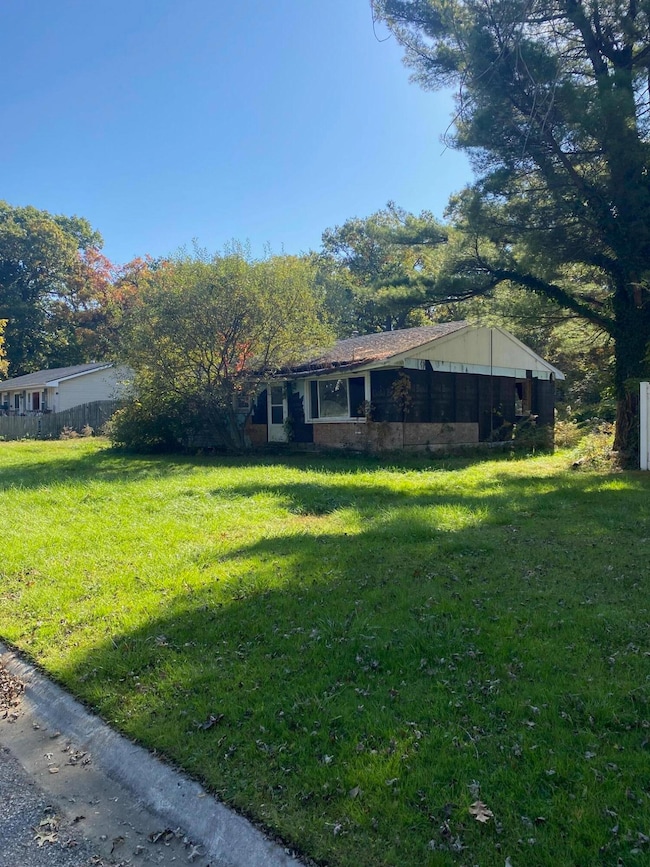
Located in unincorporated Calumet Township. Building is UNSAFE. DO NOT ENTER THE BUILDING. This lot has a septic system and well (do not know if they are operable). This is a sweet, peaceful, tree lined neighborhood. This is located on a dead end street very low traffic. Complete rehab to be done. Sold as is.
Home Details
Home Type
- Single Family
Est. Annual Taxes
- $541
Year Built
- Built in 1966
Interior Spaces
- 1,120 Sq Ft Home
- 1-Story Property
- Living Room
- Property Views
Bedrooms and Bathrooms
- 3 Bedrooms
- 1 Full Bathroom
Additional Features
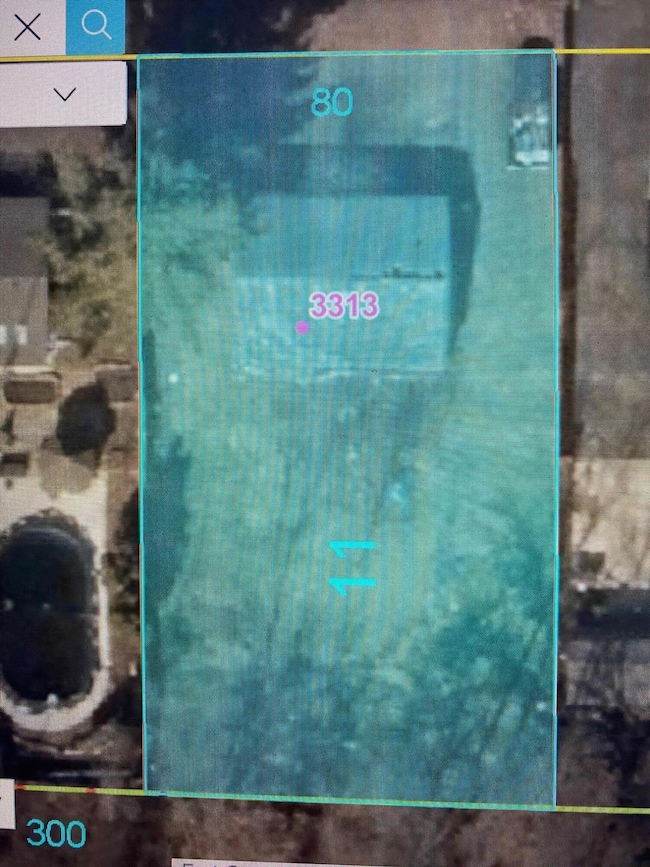
- 0.26 Acre Lot
- Well
Community Details
- No Home Owners Association
- Tower Oaks Subdivision
Listing and Financial Details
- Assessor Parcel Number 450831478003000001
Map
Home Values in the Area
Average Home Value in this Area
Tax History
| Year | Tax Paid | Tax Assessment Tax Assessment Total Assessment is a certain percentage of the fair market value that is determined by local assessors to be the total taxable value of land and additions on the property. | Land | Improvement |
|---|---|---|---|---|
| 2024 | $946 | $22,800 | $16,200 | $6,600 |
| 2023 | $444 | $22,200 | $16,200 | $6,000 |
| 2022 | $456 | $22,400 | $16,000 | $6,400 |
| 2021 | $1,259 | $62,600 | $16,000 | $46,600 |
| 2020 | $1,245 | $61,900 | $16,000 | $45,900 |
| 2019 | $2,685 | $60,300 | $15,300 | $45,000 |
| 2018 | $2,801 | $54,000 | $14,600 | $39,400 |
| 2017 | $1,809 | $61,900 | $14,600 | $47,300 |
| 2016 | $1,954 | $67,300 | $14,300 | $53,000 |
| 2014 | $1,876 | $64,100 | $14,600 | $49,500 |
| 2013 | $1,785 | $63,700 | $14,600 | $49,100 |
Property History
| Date | Event | Price | List to Sale | Price per Sq Ft |
|---|---|---|---|---|
| 10/31/2025 10/31/25 | For Sale | $55,000 | -- | $49 / Sq Ft |
Purchase History
| Date | Type | Sale Price | Title Company |
|---|---|---|---|
| Quit Claim Deed | -- | None Listed On Document | |
| Special Warranty Deed | -- | -- | |
| Warranty Deed | -- | -- | |
| Public Action Common In Florida Clerks Tax Deed Or Tax Deeds Or Property Sold For Taxes | $20,300 | None Listed On Document | |
| Limited Warranty Deed | -- | Meridian Title Corp | |
| Special Warranty Deed | -- | None Available | |
| Sheriffs Deed | $61,951 | None Available |
Source: Northwest Indiana Association of REALTORS®
MLS Number: 830147
APN: 45-08-31-478-003.000-001
Disclaimer: Certain information contained herein is derived from information provided by parties other than Homes.com. All information provided is deemed reliable, but is not guaranteed to be accurate and should be independently verified.
![]() Copyright 2025 MuItiple Listing Service of the Northwest Indiana Realtors Association Multiple Listing Service (NIRA MLS). All rights reserved. IDX information is provided exclusively for personal, non-commercial use, and may not be used for any purpose other than to identify prospective properties consumers may be interested in purchasing. Information is deemed reliable but not guaranteed.
Copyright 2025 MuItiple Listing Service of the Northwest Indiana Realtors Association Multiple Listing Service (NIRA MLS). All rights reserved. IDX information is provided exclusively for personal, non-commercial use, and may not be used for any purpose other than to identify prospective properties consumers may be interested in purchasing. Information is deemed reliable but not guaranteed.
- 3512 W 48th Ct
- 3521-23 W 47th Ave
- 4695 Whitcomb St
- 2142 W 51st Ave
- 4960 Cleveland St
- 4900 Arthur St
- 5312 Arthur St
- 4507 W 45th Ave
- 4401 W Taft St
- 4673 Arthur St
- 6033 Taft Place
- 2680 W 59th Place
- 2725 W 42nd Ave
- 600 W 55th Ave
- 4645 Hayes St
- 1481 W 54th Ave
- 1711 W 57th Ave
- 1420 W 47th Ave
- 1850 W 58th Place
- 4055 Marshall Place
- 4720 Ellsworth Ln
- 1718 W 55th Ave
- 1240 W 52nd Dr
- 5790 Grant St
- 139 N Dwiggins St
- 1145 N Glenwood Ave
- 400 Glen Park Ave
- 4172 Jefferson St
- 5370 Connecticut St
- 5142 Pennsylvania St
- 838 N Elmer St
- 6643 Prairie Rose Dr
- 712 E 49th Ave
- 838 W 67th Ln
- 1800 Park West Blvd
- 2963 W 74th Ave
- 3755 W 75th Ct Unit ID1285097P
- 3464 Pennsylvania St
- 7654 Whitcomb St Unit D
- 1010 W Pine St
