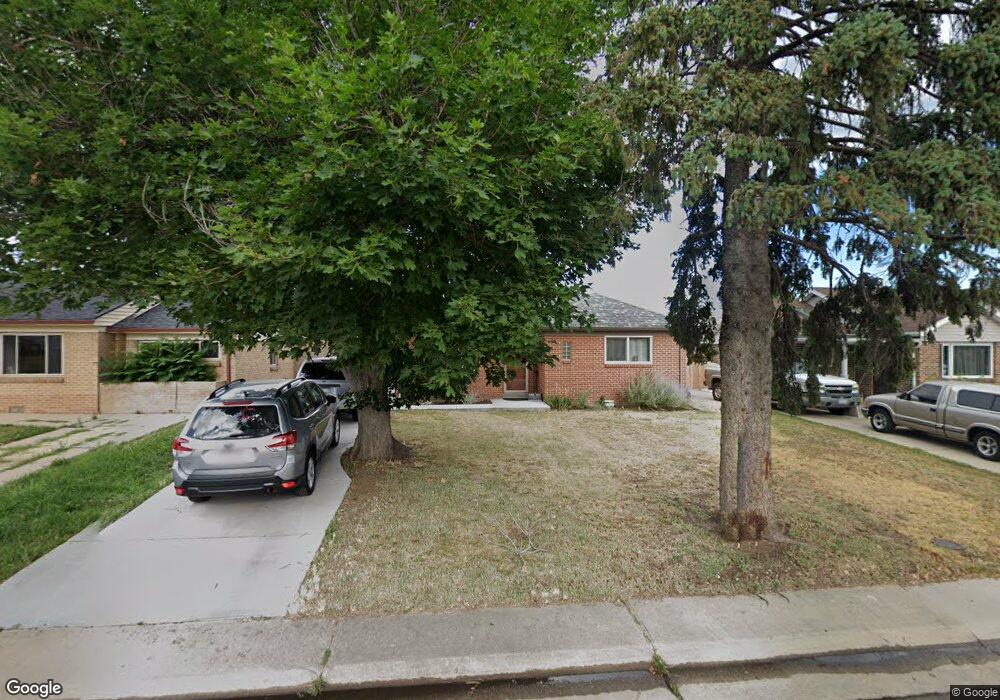
3315 Locust St Denver, CO 80207
Northeast Park Hill NeighborhoodEstimated Value: $440,381 - $529,000
3
Beds
1
Bath
1,666
Sq Ft
$287/Sq Ft
Est. Value
About This Home
This home is located at 3315 Locust St, Denver, CO 80207 and is currently estimated at $478,095, approximately $286 per square foot. 3315 Locust St is a home located in Denver County with nearby schools including Margaret M Smith Elementary School, William (Bill) Roberts ECE-8 School, and McAuliffe International School.
Ownership History
Date
Name
Owned For
Owner Type
Purchase Details
Closed on
Sep 5, 2014
Sold by
Hayduk Emily Rachel
Bought by
Byrne John and Salvador Ellen
Current Estimated Value
Home Financials for this Owner
Home Financials are based on the most recent Mortgage that was taken out on this home.
Original Mortgage
$237,650
Outstanding Balance
$179,890
Interest Rate
4.15%
Mortgage Type
New Conventional
Estimated Equity
$298,205
Purchase Details
Closed on
Mar 8, 2013
Sold by
Keen Investments Lp
Bought by
Hayduk Emily Rachel
Home Financials for this Owner
Home Financials are based on the most recent Mortgage that was taken out on this home.
Original Mortgage
$176,641
Interest Rate
3.57%
Mortgage Type
FHA
Purchase Details
Closed on
Sep 17, 2012
Sold by
Scott Geraldine Brwn
Bought by
Keen Investments Lp
Home Financials for this Owner
Home Financials are based on the most recent Mortgage that was taken out on this home.
Original Mortgage
$64,000
Interest Rate
3.59%
Mortgage Type
Purchase Money Mortgage
Create a Home Valuation Report for This Property
The Home Valuation Report is an in-depth analysis detailing your home's value as well as a comparison with similar homes in the area
Home Values in the Area
Average Home Value in this Area
Purchase History
| Date | Buyer | Sale Price | Title Company |
|---|---|---|---|
| Byrne John | $245,000 | Fidelity National Title Ins | |
| Hayduk Emily Rachel | $179,900 | First American | |
| Keen Investments Lp | $80,000 | Enterprise Title Lllp |
Source: Public Records
Mortgage History
| Date | Status | Borrower | Loan Amount |
|---|---|---|---|
| Open | Byrne John | $237,650 | |
| Previous Owner | Hayduk Emily Rachel | $176,641 | |
| Previous Owner | Keen Investments Lp | $64,000 |
Source: Public Records
Tax History
| Year | Tax Paid | Tax Assessment Tax Assessment Total Assessment is a certain percentage of the fair market value that is determined by local assessors to be the total taxable value of land and additions on the property. | Land | Improvement |
|---|---|---|---|---|
| 2025 | $2,228 | $33,240 | $13,210 | $13,210 |
| 2024 | $2,228 | $28,130 | $8,870 | $19,260 |
| 2023 | $2,180 | $28,130 | $8,870 | $19,260 |
| 2022 | $1,862 | $23,410 | $8,680 | $14,730 |
| 2021 | $1,798 | $24,090 | $8,930 | $15,160 |
| 2020 | $1,836 | $24,740 | $8,930 | $15,810 |
| 2019 | $1,784 | $24,740 | $8,930 | $15,810 |
| 2018 | $1,582 | $20,450 | $5,850 | $14,600 |
| 2017 | $1,577 | $20,450 | $5,850 | $14,600 |
| 2016 | $1,446 | $17,730 | $5,970 | $11,760 |
| 2015 | $1,385 | $17,730 | $5,970 | $11,760 |
| 2014 | $1,066 | $12,830 | $3,980 | $8,850 |
Source: Public Records
Map
Nearby Homes
- 3280 Leyden St
- 6325 Martin Luther King Junior Blvd
- 3287 Krameria St
- 3269 Krameria St
- 3290 Magnolia St
- 3360 Magnolia St
- 3563 Leyden St
- 3302 Jasmine St
- 3045 N Monaco Street Pkwy
- 3021 Locust St
- 3035 N Monaco Street Pkwy
- 3376 Jasmine St
- 3540 Niagara St
- 3627 Leyden St
- 3311 Oneida St
- 3580 Newport St
- 2901 Monaco Pkwy
- 3551 Olive St
- 3685 Jasmine St
- 2901 Niagara St
- 3307 Locust St
- 3325 Locust St
- 3301 Locust St
- 3333 Locust St
- 3308 Locust St
- 3324 Locust St
- 3316 Locust St
- 3339 Locust St
- 3316 Leyden St
- 3332 Locust St
- 3300 Locust St
- 3324 Leyden St
- 3308 Leyden St
- 6301 E 33rd Ave
- 3295 Locust St
- 3345 Locust St
- 3332 Leyden St
- 3340 Locust St
- 3348 Locust St
- 3290 Locust St
Your Personal Tour Guide
Ask me questions while you tour the home.