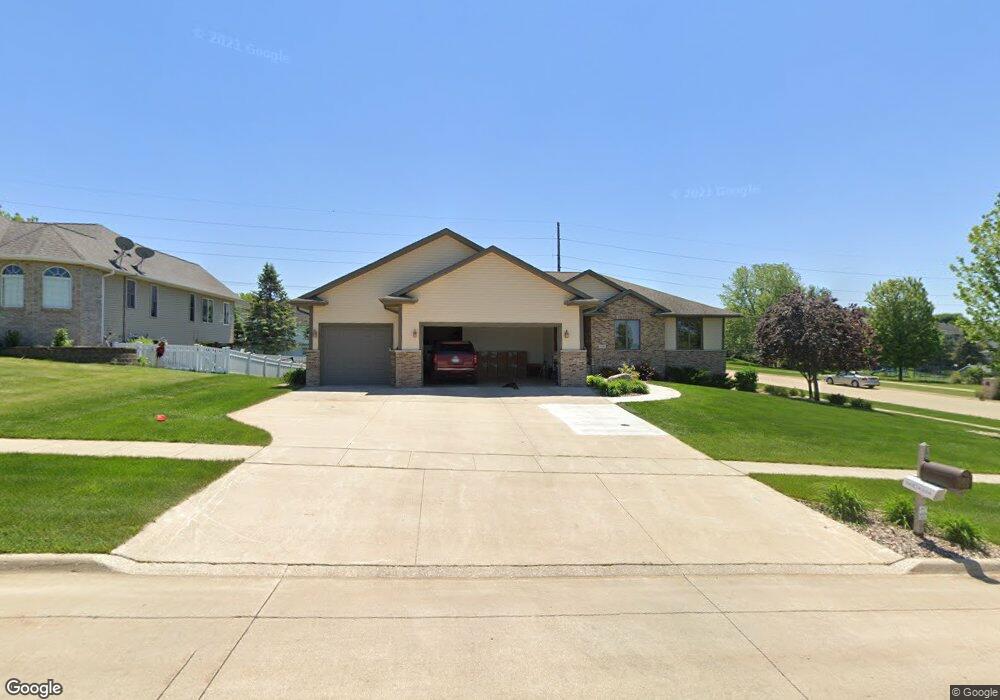
3318 Apollo St Cedar Falls, IA 50613
Estimated Value: $472,280 - $531,000
4
Beds
5
Baths
1,858
Sq Ft
$268/Sq Ft
Est. Value
About This Home
This home is located at 3318 Apollo St, Cedar Falls, IA 50613 and is currently estimated at $498,070, approximately $268 per square foot. 3318 Apollo St is a home located in Black Hawk County with nearby schools including Helen A. Hansen Elementary School, Holmes Junior High School, and Cedar Falls High School.
Ownership History
Date
Name
Owned For
Owner Type
Purchase Details
Closed on
Feb 26, 2025
Sold by
Ahrenstorff Joshua Lee
Bought by
Ahrenstorff Ashley Ann
Current Estimated Value
Purchase Details
Closed on
Jul 28, 2021
Sold by
Owen Rodney J and Owen Kortney M
Bought by
Ahrenstorff Joshua and Ahrenstorff Ashley
Home Financials for this Owner
Home Financials are based on the most recent Mortgage that was taken out on this home.
Original Mortgage
$276,000
Interest Rate
2.93%
Mortgage Type
New Conventional
Purchase Details
Closed on
Jan 23, 2018
Bought by
Owen Rodney and Owen Kortney Marie Shar
Home Financials for this Owner
Home Financials are based on the most recent Mortgage that was taken out on this home.
Original Mortgage
$150,000
Interest Rate
4.04%
Create a Home Valuation Report for This Property
The Home Valuation Report is an in-depth analysis detailing your home's value as well as a comparison with similar homes in the area
Home Values in the Area
Average Home Value in this Area
Purchase History
| Date | Buyer | Sale Price | Title Company |
|---|---|---|---|
| Ahrenstorff Ashley Ann | -- | None Listed On Document | |
| Ahrenstorff Joshua | $376,000 | Title Services Corporation | |
| Owen Rodney | $190,000 | -- |
Source: Public Records
Mortgage History
| Date | Status | Borrower | Loan Amount |
|---|---|---|---|
| Previous Owner | Ahrenstorff Joshua | $276,000 | |
| Previous Owner | Owen Rodney | $150,000 | |
| Previous Owner | Owen Rodney | -- |
Source: Public Records
Tax History
| Year | Tax Paid | Tax Assessment Tax Assessment Total Assessment is a certain percentage of the fair market value that is determined by local assessors to be the total taxable value of land and additions on the property. | Land | Improvement |
|---|---|---|---|---|
| 2025 | $6,250 | $465,750 | $74,950 | $390,800 |
| 2024 | $6,250 | $388,370 | $74,950 | $313,420 |
| 2023 | $6,886 | $388,370 | $74,950 | $313,420 |
| 2022 | $6,766 | $372,980 | $74,950 | $298,030 |
| 2021 | $6,402 | $371,120 | $74,950 | $296,170 |
| 2020 | $6,270 | $352,380 | $56,210 | $296,170 |
| 2019 | $6,270 | $352,380 | $56,210 | $296,170 |
| 2018 | $6,350 | $352,380 | $56,210 | $296,170 |
| 2017 | $6,492 | $352,380 | $56,210 | $296,170 |
| 2016 | $6,072 | $352,380 | $56,210 | $296,170 |
| 2015 | $6,072 | $352,380 | $56,210 | $296,170 |
| 2014 | $5,878 | $337,570 | $56,210 | $281,360 |
Source: Public Records
Map
Nearby Homes
- 3413 Pheasant Dr
- 3702 Apollo St
- 2912 W 4th St Unit 2
- 2718 Ryan Dr
- 114 Parkgate Rd
- 4128 Shocker Rd
- 4124 Thresher Ct Unit 306
- 4125 Autumn Ridge Rd Unit 102
- 405 Golden Ln
- Lots 1-2 Nordic Dr
- Lots 5-6 Nordic Dr
- Lots 3-4 Nordic Dr
- 4305 Autumn Ridge Rd Unit 219
- 0 W Glen Development Land
- 0 W 1st St
- 435 Autumn Ln Unit 3
- 435 Autumn Ln Unit 2
- 435 Autumn Ln Unit 1
- 4320 Autumn Ridge Rd
- 2706 Country Meadow Ln
- 3310 Apollo St
- Lot 5 Shelley Ct
- Lot 4 Shelley Ct
- Lot 9 Shelley Ct
- Lot 8 Shelley Ct
- Lot 7 Shelley Ct
- Lot 6 Shelley Ct
- Lot 10 Shelley Ct
- 3317 Pheasant Dr
- 213 Shelly Ln
- 3307 Pheasant Dr
- 3313 Apollo St
- 3302 Apollo St
- 3403 Pheasant Dr
- 3301 Pheasant Dr
- 3407 Apollo St
- 3233 Crescent Dr
- 3222 Apollo St
- 3221 Pheasant Dr
- 3418 Apollo St Unit Pheasant Hollow Lot
Your Personal Tour Guide
Ask me questions while you tour the home.