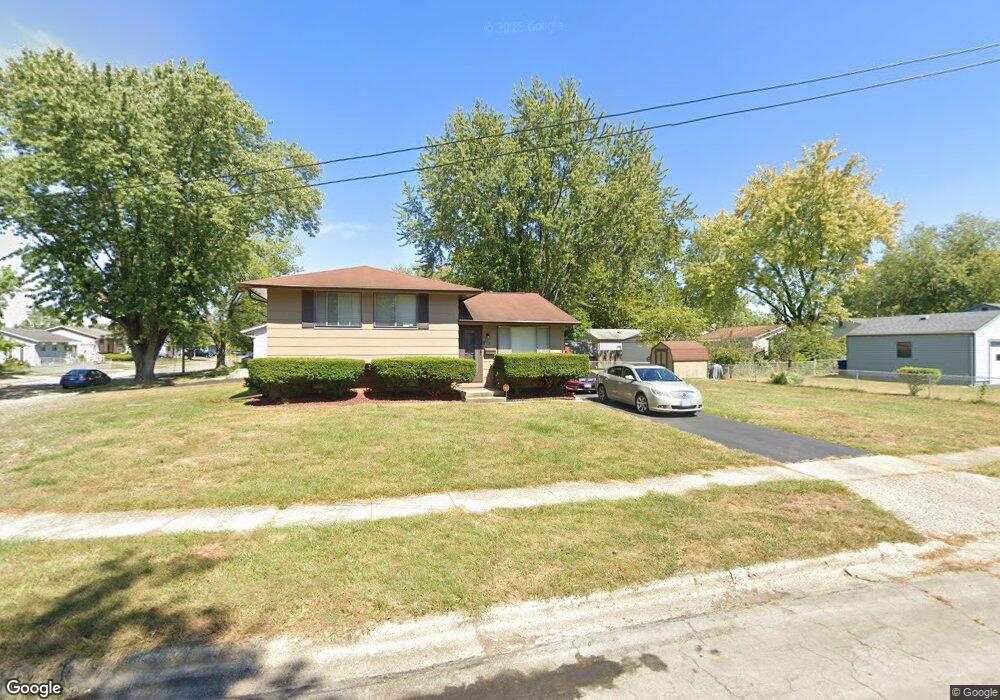
3318 Balford Square S Columbus, OH 43232
Glenbrook NeighborhoodEstimated Value: $226,470 - $253,000
3
Beds
2
Baths
1,444
Sq Ft
$162/Sq Ft
Est. Value
About This Home
This home is located at 3318 Balford Square S, Columbus, OH 43232 and is currently estimated at $234,368, approximately $162 per square foot. 3318 Balford Square S is a home located in Franklin County with nearby schools including Easthaven Elementary School, Yorktown Middle School, and Independence High School.
Ownership History
Date
Name
Owned For
Owner Type
Purchase Details
Closed on
Feb 10, 2021
Sold by
Graham Von R
Bought by
Massey Barrett Angela and Barrett Lymott
Current Estimated Value
Home Financials for this Owner
Home Financials are based on the most recent Mortgage that was taken out on this home.
Original Mortgage
$159,065
Interest Rate
2.7%
Mortgage Type
FHA
Purchase Details
Closed on
May 31, 2017
Sold by
Graham Barbara A
Bought by
Graham Von R
Purchase Details
Closed on
May 23, 2001
Sold by
Nagy Edward J and Nagy Katherine S
Bought by
Graham Von R and Graham Barbara A
Home Financials for this Owner
Home Financials are based on the most recent Mortgage that was taken out on this home.
Original Mortgage
$72,165
Interest Rate
12.5%
Mortgage Type
Purchase Money Mortgage
Purchase Details
Closed on
Dec 1, 1978
Bought by
Nagy Edward J
Purchase Details
Closed on
Dec 4, 1977
Bought by
Nagy Edward J
Create a Home Valuation Report for This Property
The Home Valuation Report is an in-depth analysis detailing your home's value as well as a comparison with similar homes in the area
Home Values in the Area
Average Home Value in this Area
Purchase History
| Date | Buyer | Sale Price | Title Company |
|---|---|---|---|
| Massey Barrett Angela | $162,000 | Crown Search Services | |
| Graham Von R | -- | None Available | |
| Graham Von R | $84,900 | Lawyers Title | |
| Nagy Edward J | $36,600 | -- | |
| Nagy Edward J | -- | -- |
Source: Public Records
Mortgage History
| Date | Status | Borrower | Loan Amount |
|---|---|---|---|
| Previous Owner | Massey Barrett Angela | $159,065 | |
| Previous Owner | Graham Von R | $72,165 |
Source: Public Records
Tax History Compared to Growth
Tax History
| Year | Tax Paid | Tax Assessment Tax Assessment Total Assessment is a certain percentage of the fair market value that is determined by local assessors to be the total taxable value of land and additions on the property. | Land | Improvement |
|---|---|---|---|---|
| 2024 | $2,636 | $58,740 | $18,100 | $40,640 |
| 2023 | $2,603 | $58,730 | $18,095 | $40,635 |
| 2022 | $1,647 | $31,750 | $8,890 | $22,860 |
| 2021 | $1,650 | $31,750 | $8,890 | $22,860 |
| 2020 | $1,652 | $31,750 | $8,890 | $22,860 |
| 2019 | $1,510 | $24,890 | $7,110 | $17,780 |
| 2018 | $1,513 | $24,890 | $7,110 | $17,780 |
| 2017 | $1,547 | $24,890 | $7,110 | $17,780 |
| 2016 | $1,675 | $25,280 | $5,570 | $19,710 |
| 2015 | $1,520 | $25,280 | $5,570 | $19,710 |
| 2014 | $1,524 | $25,280 | $5,570 | $19,710 |
| 2013 | $791 | $26,600 | $5,845 | $20,755 |
Source: Public Records
Map
Nearby Homes
- 2252 Meridian Ct
- 2275 Cardston Ct
- 3365 Bruceton Ave
- 3054 Wadsworth Ct
- 3038 Wadsworth Ct
- 3036 Wadsworth Ct
- 2425 Mason Village Ct Unit 2425
- 1836 Penfield Ct S
- 3830 Charbonnett Ct Unit 6-A
- 2472 Nassau Dr Unit 37D
- 0 Ravenswood Ct
- 3325 E Deshler Ave
- 2971 Queensrowe Dr
- 1664 Barnett Rd
- 3246 E Deshler Ave
- 2509 Burgandy Ln Unit 46B
- 2503 Burgandy Ln Unit 46A
- 1767 Alcoy Dr
- 1624 Miltwood Rd
- 1782 Newfield Rd
- 2176 Balford Square W
- 2168 Balford Square W
- 2183 Balford Square E
- 3317 Balford Square S
- 2175 Balford Square E
- 3309 Balford Square S
- 3323 Balford Square S
- 2160 Balford Square W
- 2181 Balford Square W
- 2175 Balford Square W
- 2169 Balford Square E
- 2187 Balford Square W
- 3331 Balford Square S
- 3303 Balford Square S
- 2167 Balford Square W
- 2154 Balford Square W
- 2161 Balford Square W
- 2163 Balford Square E
- 2198 Balford Square E
- 3337 Balford Square S