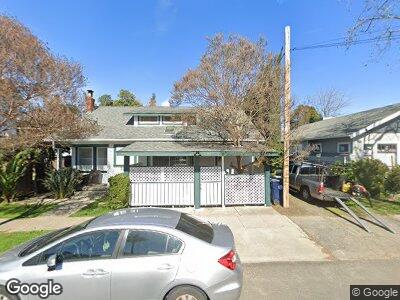
3319 N St Sacramento, CA 95816
East Sacramento NeighborhoodEstimated Value: $485,901 - $661,000
2
Beds
1
Bath
1,179
Sq Ft
$488/Sq Ft
Est. Value
About This Home
This home is located at 3319 N St, Sacramento, CA 95816 and is currently estimated at $574,975, approximately $487 per square foot. 3319 N St is a home located in Sacramento County with nearby schools including David Lubin Elementary, Miwok Middle School, and Hiram W. Johnson High School.
Ownership History
Date
Name
Owned For
Owner Type
Purchase Details
Closed on
Dec 14, 2012
Sold by
Krizman John J and Krizman Joan M
Bought by
Krizman John J and Krizman Joan M
Current Estimated Value
Create a Home Valuation Report for This Property
The Home Valuation Report is an in-depth analysis detailing your home's value as well as a comparison with similar homes in the area
Home Values in the Area
Average Home Value in this Area
Tax History Compared to Growth
Tax History
| Year | Tax Paid | Tax Assessment Tax Assessment Total Assessment is a certain percentage of the fair market value that is determined by local assessors to be the total taxable value of land and additions on the property. | Land | Improvement |
|---|---|---|---|---|
| 2024 | $1,553 | $116,615 | $108,300 | $8,315 |
| 2023 | $1,517 | $114,329 | $106,177 | $8,152 |
| 2022 | $1,491 | $112,089 | $104,096 | $7,993 |
| 2021 | $1,424 | $109,892 | $102,055 | $7,837 |
| 2020 | $1,432 | $108,766 | $101,009 | $7,757 |
| 2019 | $1,403 | $106,634 | $99,029 | $7,605 |
| 2018 | $1,367 | $104,544 | $97,088 | $7,456 |
| 2017 | $1,348 | $102,495 | $95,185 | $7,310 |
| 2016 | $1,278 | $100,486 | $93,319 | $7,167 |
| 2015 | $1,259 | $98,978 | $91,918 | $7,060 |
| 2014 | $1,228 | $97,040 | $90,118 | $6,922 |
Source: Public Records
Map
Nearby Homes