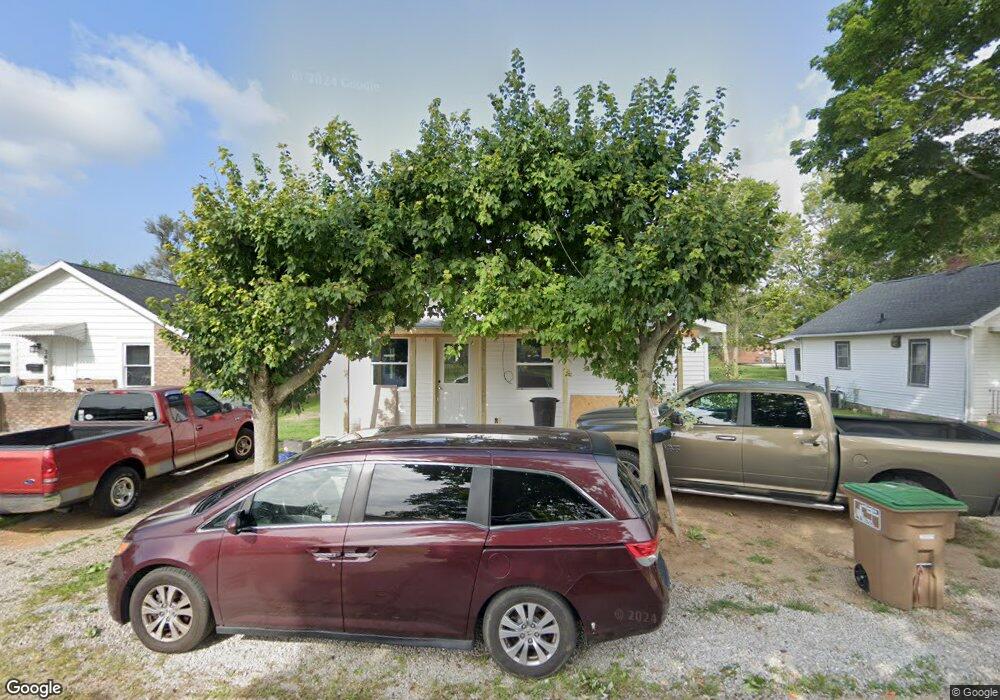
332 Pence St Columbus, IN 47201
Estimated Value: $136,000 - $173,000
2
Beds
1
Bath
924
Sq Ft
$165/Sq Ft
Est. Value
About This Home
This home is located at 332 Pence St, Columbus, IN 47201 and is currently estimated at $152,125, approximately $164 per square foot. 332 Pence St is a home located in Bartholomew County with nearby schools including Clifty Creek Elementary School, Central Middle School, and Columbus East High School.
Ownership History
Date
Name
Owned For
Owner Type
Purchase Details
Closed on
Mar 5, 2024
Sold by
Ownez Asset Management Llc
Bought by
Ownez Holdings 1 Llc
Current Estimated Value
Purchase Details
Closed on
Jun 20, 2016
Sold by
S C G J Llc
Bought by
Pcp 1 Inc
Purchase Details
Closed on
Aug 24, 2009
Sold by
Ib Property Holdings Llc
Bought by
Rodenheber Elke
Purchase Details
Closed on
Jul 14, 2009
Sold by
Bayview Financial Property Trust and Conway Katherine Jane
Bought by
Ib Property Holdings Llc
Create a Home Valuation Report for This Property
The Home Valuation Report is an in-depth analysis detailing your home's value as well as a comparison with similar homes in the area
Home Values in the Area
Average Home Value in this Area
Purchase History
| Date | Buyer | Sale Price | Title Company |
|---|---|---|---|
| Ownez Holdings 1 Llc | $10 | Kc Wilson & Associates | |
| Pcp 1 Inc | -- | Attorney | |
| Rodenheber Elke | -- | Attorney | |
| Ib Property Holdings Llc | $29,800 | None Available |
Source: Public Records
Tax History Compared to Growth
Tax History
| Year | Tax Paid | Tax Assessment Tax Assessment Total Assessment is a certain percentage of the fair market value that is determined by local assessors to be the total taxable value of land and additions on the property. | Land | Improvement |
|---|---|---|---|---|
| 2024 | $2,141 | $95,200 | $20,300 | $74,900 |
| 2023 | $2,029 | $88,900 | $20,300 | $68,600 |
| 2022 | $1,865 | $82,300 | $20,300 | $62,000 |
| 2021 | $408 | $62,900 | $10,500 | $52,400 |
| 2020 | $1,182 | $51,300 | $10,500 | $40,800 |
| 2019 | $1,063 | $46,900 | $10,500 | $36,400 |
| 2018 | $1,195 | $47,100 | $10,500 | $36,600 |
| 2017 | $1,032 | $46,900 | $10,200 | $36,700 |
| 2016 | $1,009 | $45,800 | $10,200 | $35,600 |
| 2014 | $927 | $41,700 | $10,200 | $31,500 |
Source: Public Records
Map
Nearby Homes
- 213 Hege Ave
- 342 Jones St
- 1631 Kentucky Ave
- 212 S Beatty St
- 2032 Indiana Ave
- 2263 Wallace Ave
- 1521 Indiana Ave
- 41 N Cherry St
- 52 N Hinman St
- 2041 Mckinley Ave
- 2651 Clifty St
- 41 N Ross St
- 51 S Brooks St
- 2905 Kentucky Ave
- 507 N Cherry St
- 620 Hutchins Ave
- 661 Smith St
- 758 N Cherry St
- 809 Hutchins Ave
- 813 Cottage Ave