332 State St Unit 2 Bristol, RI 02809
Downtown Bristol NeighborhoodEstimated Value: $554,000 - $671,000
2
Beds
1
Bath
700
Sq Ft
$858/Sq Ft
Est. Value
About This Home
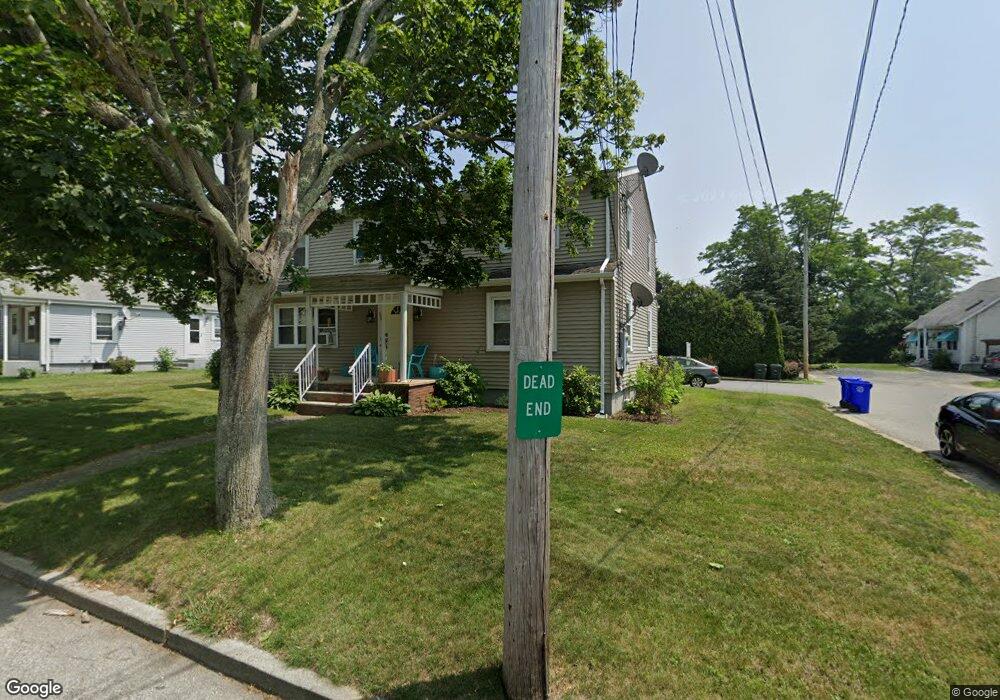
This home is located at 332 State St Unit 2, Bristol, RI 02809 and is currently estimated at $600,897, approximately $858 per square foot. 332 State St Unit 2 is a home located in Bristol County with nearby schools including Mt. Hope High School, Our Lady of Mt. Carmel School, and East Bay Career Academy.
Ownership History
Date
Name
Owned For
Owner Type
Purchase Details
Closed on
Jun 21, 2017
Sold by
Dugan Roseann
Bought by
Moran Antonette
Current Estimated Value
Purchase Details
Closed on
Apr 24, 2002
Sold by
Natale Peteer J and Natale Judith
Bought by
Dugan Ronald H and Dugan Roseann
Purchase Details
Closed on
Apr 5, 1989
Sold by
Natale Peter
Bought by
Karouz Joseph
Create a Home Valuation Report for This Property
The Home Valuation Report is an in-depth analysis detailing your home's value as well as a comparison with similar homes in the area
Home Values in the Area
Average Home Value in this Area
Purchase History
| Date | Buyer | Sale Price | Title Company |
|---|---|---|---|
| Moran Antonette | $245,000 | -- | |
| Dugan Ronald H | $40,500 | -- | |
| Karouz Joseph | $55,000 | -- |
Source: Public Records
Mortgage History
| Date | Status | Borrower | Loan Amount |
|---|---|---|---|
| Previous Owner | Karouz Joseph | $56,500 | |
| Previous Owner | Karouz Joseph | $192,000 | |
| Previous Owner | Karouz Joseph | $187,500 |
Source: Public Records
Tax History
| Year | Tax Paid | Tax Assessment Tax Assessment Total Assessment is a certain percentage of the fair market value that is determined by local assessors to be the total taxable value of land and additions on the property. | Land | Improvement |
|---|---|---|---|---|
| 2025 | $4,747 | $343,500 | $132,600 | $210,900 |
| 2024 | $4,747 | $343,500 | $132,600 | $210,900 |
| 2023 | $4,589 | $343,500 | $132,600 | $210,900 |
| 2022 | $4,466 | $343,500 | $132,600 | $210,900 |
| 2021 | $4,121 | $286,600 | $118,200 | $168,400 |
| 2020 | $4,032 | $286,600 | $118,200 | $168,400 |
| 2019 | $3,932 | $286,600 | $118,200 | $168,400 |
| 2018 | $4,053 | $263,500 | $91,100 | $172,400 |
| 2017 | $3,360 | $225,200 | $75,000 | $150,200 |
| 2016 | $3,326 | $225,200 | $75,000 | $150,200 |
| 2015 | $3,160 | $225,200 | $75,000 | $150,200 |
| 2014 | $3,279 | $251,100 | $110,100 | $141,000 |
Source: Public Records
Map
Nearby Homes
- 293 State St
- 30 Massasoit Ave
- 6 Beatrice Ln
- 25 Massasoit Ave
- 27 Massasoit Ave
- 11 Gladding St
- 53 Catherine St
- 2 Chilton St
- 2 Wilson St
- 85 Bay View Ave Unit 2
- 107 Franklin St
- 88 Burton St
- 79 Hopeworth Ave
- 9 Howe St
- 78 State St
- 413 High St
- 44 Bradford St Unit 49
- 18 State St Unit 5 (3rd Floor East)
- 30 Sowams Dr
- 48 Narrows Rd