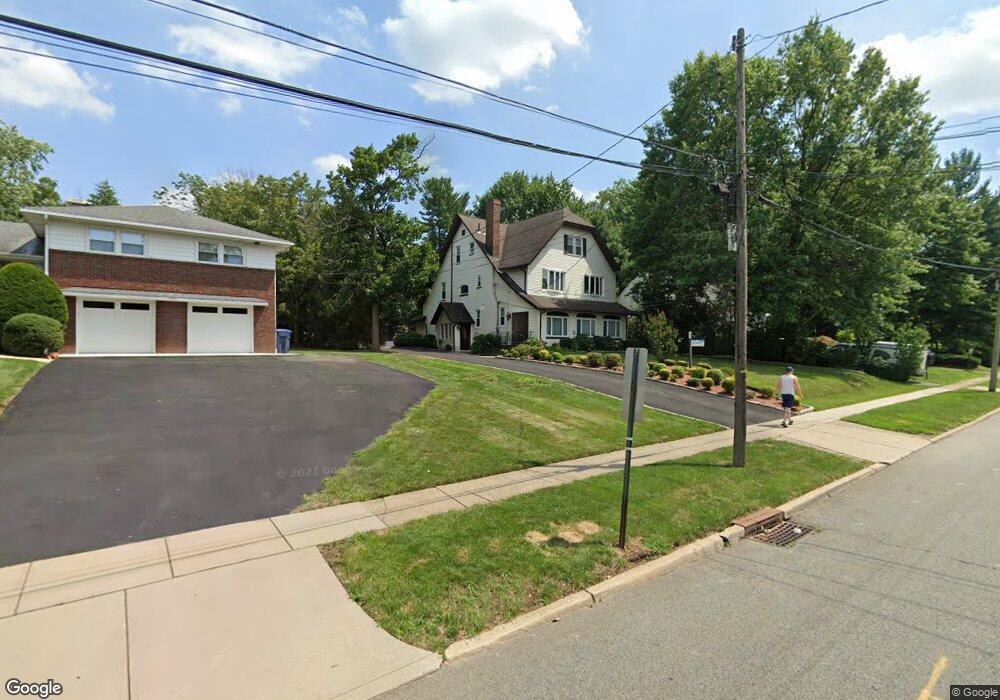
332 Summit Ave Hackensack, NJ 07601
Estimated Value: $1,148,037
Studio
--
Bath
3,165
Sq Ft
$363/Sq Ft
Est. Value
About This Home
This home is located at 332 Summit Ave, Hackensack, NJ 07601 and is currently estimated at $1,148,037, approximately $362 per square foot. 332 Summit Ave is a home located in Bergen County with nearby schools including Hackensack High School and Bergen County Christian Academy.
Ownership History
Date
Name
Owned For
Owner Type
Purchase Details
Closed on
Jul 10, 2006
Sold by
Munta Amichan
Bought by
Kube Properties Llc
Current Estimated Value
Home Financials for this Owner
Home Financials are based on the most recent Mortgage that was taken out on this home.
Original Mortgage
$608,000
Outstanding Balance
$362,149
Interest Rate
6.71%
Mortgage Type
Commercial
Estimated Equity
$785,888
Purchase Details
Closed on
Feb 28, 2005
Sold by
East Coast Acquisitions Llc
Bought by
Munta Amichan
Purchase Details
Closed on
Dec 28, 2004
Sold by
Khan Ijaz Mahboob
Bought by
East Coast Acquisitions Llc
Purchase Details
Closed on
Mar 31, 1994
Sold by
Monaco Ettore and Monaco Providenza
Bought by
Mahboob Ijaz and Kahn Ayaz Ali
Home Financials for this Owner
Home Financials are based on the most recent Mortgage that was taken out on this home.
Original Mortgage
$189,000
Interest Rate
7.27%
Mortgage Type
Commercial
Create a Home Valuation Report for This Property
The Home Valuation Report is an in-depth analysis detailing your home's value as well as a comparison with similar homes in the area
Home Values in the Area
Average Home Value in this Area
Purchase History
| Date | Buyer | Sale Price | Title Company |
|---|---|---|---|
| Kube Properties Llc | $760,000 | -- | |
| Munta Amichan | $497,000 | -- | |
| East Coast Acquisitions Llc | $415,000 | -- | |
| Mahboob Ijaz | $200,000 | -- |
Source: Public Records
Mortgage History
| Date | Status | Borrower | Loan Amount |
|---|---|---|---|
| Open | Kube Properties Llc | $608,000 | |
| Previous Owner | Mahboob Ijaz | $189,000 |
Source: Public Records
Tax History
| Year | Tax Paid | Tax Assessment Tax Assessment Total Assessment is a certain percentage of the fair market value that is determined by local assessors to be the total taxable value of land and additions on the property. | Land | Improvement |
|---|---|---|---|---|
| 2025 | $17,251 | $564,500 | $224,400 | $340,100 |
| 2024 | $16,252 | $564,500 | $224,400 | $340,100 |
| 2023 | $15,593 | $564,500 | $224,400 | $340,100 |
| 2022 | $15,593 | $556,500 | $218,500 | $338,000 |
| 2021 | $15,609 | $465,000 | $196,700 | $268,300 |
| 2020 | $15,387 | $465,000 | $196,700 | $268,300 |
| 2019 | $15,372 | $457,900 | $193,800 | $264,100 |
| 2018 | $15,423 | $451,900 | $190,000 | $261,900 |
| 2017 | $15,207 | $445,300 | $187,600 | $257,700 |
| 2016 | $14,421 | $426,900 | $173,400 | $253,500 |
| 2015 | $18,883 | $539,500 | $210,700 | $328,800 |
| 2014 | $17,922 | $539,500 | $210,700 | $328,800 |
Source: Public Records
Map
Nearby Homes
- 307 Prospect Ave Unit 14I
- 307 Prospect Ave Unit 17D
- 307 Prospect Ave Unit 16A
- 316 Prospect Ave Unit 8D
- 316 Prospect Ave Unit 8H
- 316 Prospect Ave Unit 2D
- 326 Prospect Ave Unit 6J
- 326 Prospect Ave Unit 12A
- 326 Prospect Ave Unit 10H
- 326 Prospect Ave Unit 8E
- 431 Blanchard Terrace
- 277 Prospect Ave Unit 4A
- 277 Prospect Ave Unit 14B
- 277 Prospect Ave Unit 18B
- 277 Prospect Ave Unit 18H
- 285 Berry St
- 280 Prospect Ave Unit 9H
- 280 Prospect Ave Unit 11H
- 280 Prospect Ave Unit 5D
- 280 Prospect Ave Unit 6J
- 328 Summit Ave
- 340 Summit Ave
- 324 Summit Ave
- 344 Summit Ave
- 320 Summit Ave
- 348 Summit Ave
- 345 Prospect Ave
- 345 Prospect Ave
- 316 Summit Ave
- 357 Prospect Ave
- 354 Summit Ave
- 329 Prospect Ave
- 331 Summit Ave
- 339 Summit Ave
- 321 Summit Ave
- 310 Summit Ave
- 363 Prospect Ave
- 345 Summit Ave
- 395 Berry St Unit F
- 317 Summit Ave
Your Personal Tour Guide
Ask me questions while you tour the home.