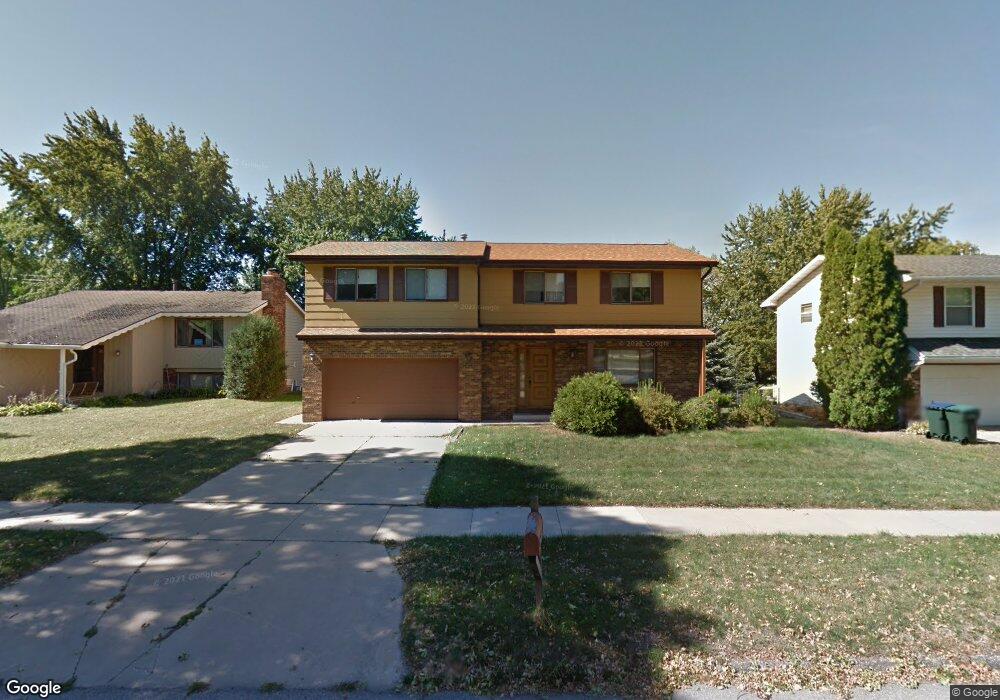
3321 Chalet Dr NW Rochester, MN 55901
John Adams NeighborhoodEstimated Value: $430,152 - $444,000
4
Beds
3
Baths
3,184
Sq Ft
$137/Sq Ft
Est. Value
About This Home
This home is located at 3321 Chalet Dr NW, Rochester, MN 55901 and is currently estimated at $437,038, approximately $137 per square foot. 3321 Chalet Dr NW is a home located in Olmsted County with nearby schools including Elton Hills Elementary School, John Adams Middle School, and John Marshall Senior High School.
Ownership History
Date
Name
Owned For
Owner Type
Purchase Details
Closed on
Aug 6, 2021
Sold by
Pratt Nicholas and Pratt Megan
Bought by
Asner Nathan D and Asner Gretchen M
Current Estimated Value
Home Financials for this Owner
Home Financials are based on the most recent Mortgage that was taken out on this home.
Original Mortgage
$351,000
Outstanding Balance
$318,687
Interest Rate
2.8%
Mortgage Type
New Conventional
Estimated Equity
$118,351
Purchase Details
Closed on
Oct 20, 2017
Sold by
Don Kendall Llc
Bought by
Pratt Nicholas and Pratt Megan
Home Financials for this Owner
Home Financials are based on the most recent Mortgage that was taken out on this home.
Original Mortgage
$254,800
Interest Rate
3.78%
Mortgage Type
New Conventional
Purchase Details
Closed on
May 26, 2016
Sold by
Woolfolk Rodney and Woolfolk Daphne B
Bought by
Don Kendall Llc
Purchase Details
Closed on
Nov 5, 2015
Sold by
Woolfolk Rodney
Bought by
Woolfolk Rodney and Woolfolk Daphne B
Create a Home Valuation Report for This Property
The Home Valuation Report is an in-depth analysis detailing your home's value as well as a comparison with similar homes in the area
Home Values in the Area
Average Home Value in this Area
Purchase History
| Date | Buyer | Sale Price | Title Company |
|---|---|---|---|
| Asner Nathan D | $390,000 | Rochester Title & Escrow Co | |
| Pratt Nicholas | $279,800 | Rochester Title | |
| Don Kendall Llc | $154,500 | Rochester Title | |
| Woolfolk Rodney | -- | Attorney | |
| Asper Nathan Nathan | $390,000 | -- |
Source: Public Records
Mortgage History
| Date | Status | Borrower | Loan Amount |
|---|---|---|---|
| Open | Asner Nathan D | $351,000 | |
| Previous Owner | Pratt Nicholas | $254,800 | |
| Closed | Asper Nathan Nathan | $351,000 |
Source: Public Records
Tax History Compared to Growth
Tax History
| Year | Tax Paid | Tax Assessment Tax Assessment Total Assessment is a certain percentage of the fair market value that is determined by local assessors to be the total taxable value of land and additions on the property. | Land | Improvement |
|---|---|---|---|---|
| 2024 | $5,680 | $413,800 | $40,000 | $373,800 |
| 2023 | $4,876 | $389,100 | $40,000 | $349,100 |
| 2022 | $4,424 | $383,500 | $40,000 | $343,500 |
| 2021 | $3,930 | $328,200 | $35,000 | $293,200 |
| 2020 | $3,830 | $294,400 | $30,000 | $264,400 |
| 2019 | $3,620 | $277,200 | $30,000 | $247,200 |
| 2018 | $2,835 | $264,600 | $30,000 | $234,600 |
| 2017 | $2,894 | $208,500 | $24,000 | $184,500 |
| 2016 | $2,570 | $198,400 | $24,000 | $174,400 |
| 2015 | $2,438 | $169,300 | $21,400 | $147,900 |
| 2014 | $2,432 | $171,600 | $21,500 | $150,100 |
| 2012 | -- | $176,400 | $21,600 | $154,800 |
Source: Public Records
Map
Nearby Homes
- 3012 Crescent Ln NW
- 905 Chalet Dr NW
- XXX County Road 22
- 19 Elton Ridge Ct NW
- 3002 7th Ave NW
- 4017 11th Ave NW
- 3348 Geselle Ln NW
- 3522 18th Ave NW
- 411 31st St NW
- 414 31st St NW
- 3305 18th Ave NW
- 3406 Leisure Ct NW
- 1407 41st St NW
- 3916 17th Ave NW
- 1840 36th St NW
- 2509 11th Ave NW
- 3037 Venice Ln NW
- 526 Zumbro Dr NW
- 3925 18th Ave NW
- 2842 19th Ave NW
- 3315 Chalet Dr NW
- 3403 Chalet Dr NW
- 1105 Knoll Ct NW
- 3409 Chalet Dr NW
- 3311 Chalet Dr NW
- 1109 Knoll Ct NW
- 1101 Knoll Ct NW
- 942 Vegas Ln NW
- 1113 Knoll Ct NW
- 1011 33rd St NW
- 941 Vegas Ln NW
- 3305 Chalet Dr NW
- 3415 Chalet Dr NW
- TBD Vegas Ln NW
- 1017 33rd St NW
- 934 Vegas Ln NW
- 943 33rd St NW
- 935 Vegas Ln NW
- 1117 Knoll Ct NW
- 3418 Chalet Dr NW