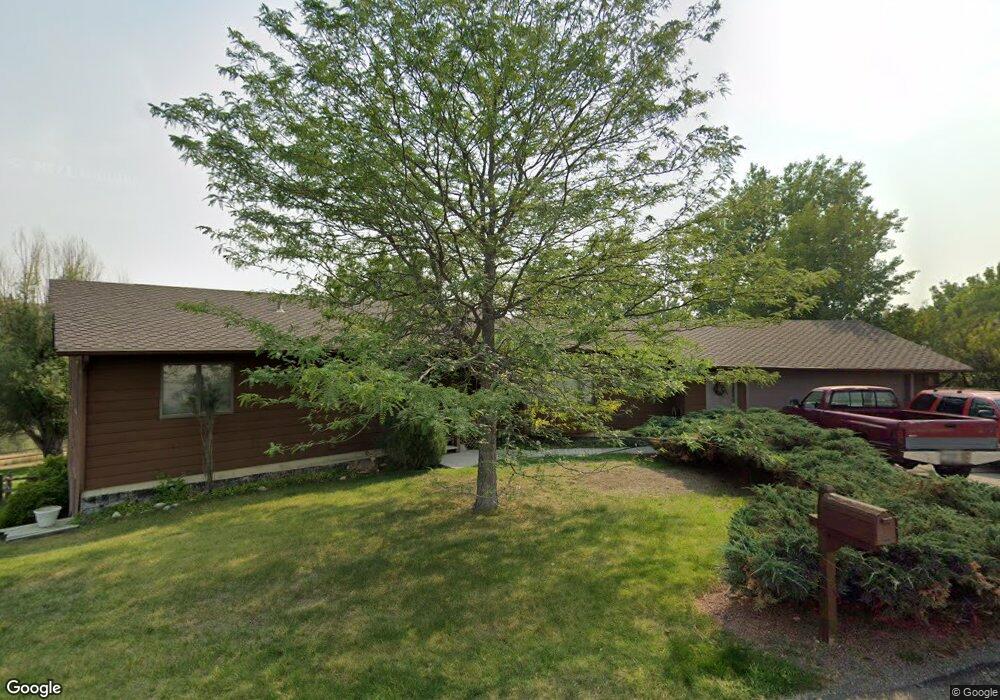
3322 Glenfinnan Rd Billings, MT 59101
Estimated Value: $530,085 - $599,000
4
Beds
4
Baths
1,980
Sq Ft
$284/Sq Ft
Est. Value
About This Home
This home is located at 3322 Glenfinnan Rd, Billings, MT 59101 and is currently estimated at $562,271, approximately $283 per square foot. 3322 Glenfinnan Rd is a home located in Yellowstone County with nearby schools including Blue Creek School, Riverside Junior High School, and Billings Senior High School.
Ownership History
Date
Name
Owned For
Owner Type
Purchase Details
Closed on
Mar 28, 2008
Sold by
Bradley Isabella G
Bought by
Atkins Tommy D and Atkins Bonita A
Current Estimated Value
Purchase Details
Closed on
Jun 28, 2005
Sold by
Hamm Bruce and Hamm Marilyn
Bought by
Denton Frederick L and Denton Donna J
Home Financials for this Owner
Home Financials are based on the most recent Mortgage that was taken out on this home.
Original Mortgage
$48,960
Interest Rate
5.58%
Mortgage Type
Stand Alone Second
Purchase Details
Closed on
Jun 27, 2005
Sold by
Denton Frederick L and Denton Donna J
Bought by
Bradley Isabella G
Home Financials for this Owner
Home Financials are based on the most recent Mortgage that was taken out on this home.
Original Mortgage
$48,960
Interest Rate
5.58%
Mortgage Type
Stand Alone Second
Create a Home Valuation Report for This Property
The Home Valuation Report is an in-depth analysis detailing your home's value as well as a comparison with similar homes in the area
Home Values in the Area
Average Home Value in this Area
Purchase History
| Date | Buyer | Sale Price | Title Company |
|---|---|---|---|
| Atkins Tommy D | -- | St | |
| Denton Frederick L | -- | None Available | |
| Bradley Isabella G | -- | St |
Source: Public Records
Mortgage History
| Date | Status | Borrower | Loan Amount |
|---|---|---|---|
| Previous Owner | Bradley Isabella G | $48,960 | |
| Previous Owner | Denton Frederick L | $48,960 | |
| Previous Owner | Bradley Isabella G | $195,840 |
Source: Public Records
Tax History Compared to Growth
Tax History
| Year | Tax Paid | Tax Assessment Tax Assessment Total Assessment is a certain percentage of the fair market value that is determined by local assessors to be the total taxable value of land and additions on the property. | Land | Improvement |
|---|---|---|---|---|
| 2025 | $4,167 | $509,700 | $73,109 | $436,591 |
| 2024 | $4,167 | $446,900 | $64,927 | $381,973 |
| 2023 | $4,344 | $446,900 | $64,927 | $381,973 |
| 2022 | $3,092 | $369,100 | $0 | $0 |
| 2021 | $3,754 | $369,100 | $0 | $0 |
| 2020 | $3,488 | $329,200 | $0 | $0 |
| 2019 | $3,375 | $329,200 | $0 | $0 |
| 2018 | $3,354 | $332,400 | $0 | $0 |
| 2017 | $3,287 | $332,400 | $0 | $0 |
| 2016 | $3,168 | $330,400 | $0 | $0 |
| 2015 | $3,055 | $330,400 | $0 | $0 |
| 2014 | $2,717 | $149,301 | $0 | $0 |
Source: Public Records
Map
Nearby Homes
- 2604 Castle Pines Dr
- 3525 Prestwick Rd
- 3041 Kincaid Rd
- 3442 Castle Pines Dr
- 3335 Mcmasters Rd
- 3155 Mcmasters Rd
- 3509 Mac Duff Cir
- 2914 Kincaid Rd
- 2315 Glengarry Ln
- 2318 Glengarry Ln
- 3205 Deer Pass Trail
- 1811 Briarwood Blvd
- BCA Lot 3 Shaia Way
- BCA Lot 4 Shaia Way
- 3748 Blue Creek Rd
- 3992 Vista View Rd
- 3947 Blue Creek Rd
- 0 Colleen Dr
- 1873 Weldon Rd
- 3831 Yorkshire Ct N
- 3306 Glenfinnan Rd
- 3321 Glenfinnan Rd
- 3313 Glenfinnan Rd
- 3327 Glenfinnan Rd
- 3305 Glenfinnan Rd
- 3335 Glenfinnan Rd
- 3410 Perth Cir
- 3318 Prestwick Rd
- 3310 Prestwick Rd
- 3304 Prestwick Rd
- 3324 Prestwick Rd
- 3414 Perth Cir
- 3418 Perth Cir
- 3403 Glenfinnan Rd
- 2827 Dumbarton Rd
- 3346 Prestwick Rd
- 3319 Prestwick Rd
- LOT 20 Glenfinnan Rd
- 0 Glenfinnan Rd
- LOT 22 Glenfinnan Rd