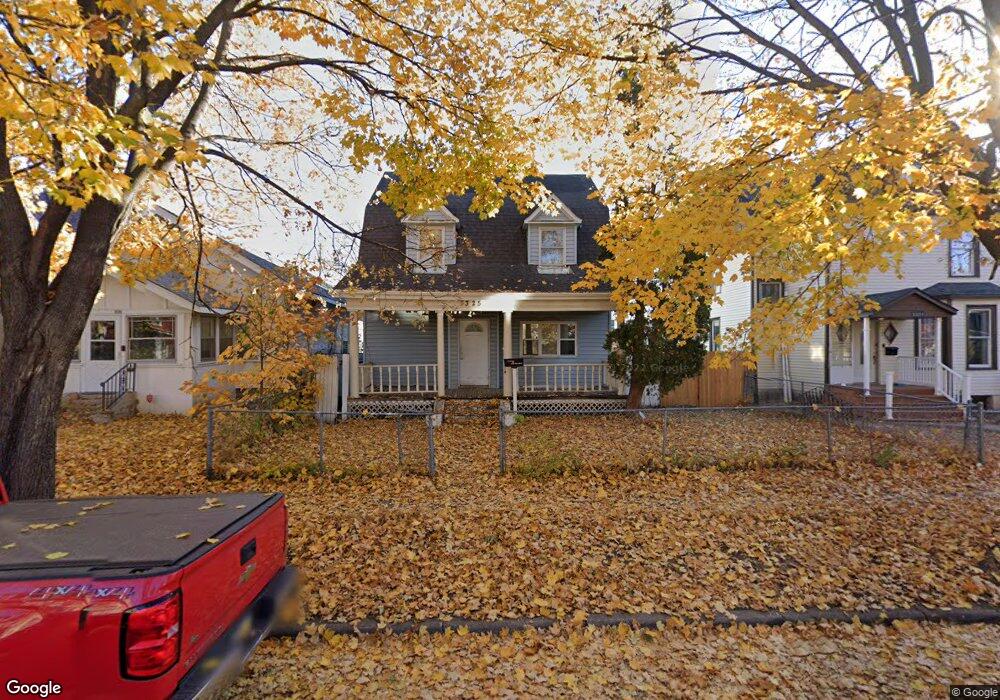
3325 Columbus Ave Minneapolis, MN 55407
Central NeighborhoodEstimated Value: $272,000 - $320,000
4
Beds
3
Baths
1,653
Sq Ft
$177/Sq Ft
Est. Value
About This Home
This home is located at 3325 Columbus Ave, Minneapolis, MN 55407 and is currently estimated at $292,137, approximately $176 per square foot. 3325 Columbus Ave is a home located in Hennepin County with nearby schools including Lyndale Elementary School, Justice Page Middle School, and Washburn High School.
Ownership History
Date
Name
Owned For
Owner Type
Purchase Details
Closed on
Sep 8, 2022
Sold by
Sard Aboh
Bought by
Mite Mohamed
Current Estimated Value
Purchase Details
Closed on
Apr 16, 2013
Sold by
Said Abdi and Garado Jihad
Bought by
Said Abdi and Garado Jihad
Purchase Details
Closed on
Sep 11, 2012
Sold by
Ali Dahir Nur and Ali Kali
Bought by
Said Abdi
Purchase Details
Closed on
Jun 3, 2010
Sold by
Federal National Mortgage Association
Bought by
Ali Dahir Nur and Garado Jilhad
Purchase Details
Closed on
Sep 4, 2009
Sold by
Olalde Norma Mejia
Bought by
Inter Savings Bank Fsb
Purchase Details
Closed on
Mar 4, 2005
Sold by
Mgic
Bought by
Vivar Edgar and Olalde Norma
Purchase Details
Closed on
Oct 31, 1997
Sold by
Humbert Ronald J
Bought by
Worth Stanley J and Worth Christina
Create a Home Valuation Report for This Property
The Home Valuation Report is an in-depth analysis detailing your home's value as well as a comparison with similar homes in the area
Home Values in the Area
Average Home Value in this Area
Purchase History
| Date | Buyer | Sale Price | Title Company |
|---|---|---|---|
| Mite Mohamed | $500 | -- | |
| Said Abdi | -- | None Available | |
| Said Abdi | -- | None Available | |
| Ali Dahir Nur | $117,000 | -- | |
| Inter Savings Bank Fsb | $198,059 | -- | |
| Inter Savings Bank Fsb | $198,059 | -- | |
| Vivar Edgar | $207,900 | -- | |
| Mortgage Guaranty Insurance Corp | $176,391 | -- | |
| Worth Stanley J | $45,500 | -- |
Source: Public Records
Tax History Compared to Growth
Tax History
| Year | Tax Paid | Tax Assessment Tax Assessment Total Assessment is a certain percentage of the fair market value that is determined by local assessors to be the total taxable value of land and additions on the property. | Land | Improvement |
|---|---|---|---|---|
| 2024 | $2,934 | $222,000 | $64,000 | $158,000 |
| 2023 | $2,774 | $228,000 | $60,000 | $168,000 |
| 2022 | $2,755 | $240,000 | $60,000 | $180,000 |
| 2021 | $3,058 | $215,000 | $30,000 | $185,000 |
| 2020 | $3,699 | $230,500 | $34,800 | $195,700 |
| 2019 | $3,452 | $230,500 | $23,200 | $207,300 |
| 2018 | $2,996 | $219,500 | $23,200 | $196,300 |
| 2017 | $3,273 | $182,500 | $21,100 | $161,400 |
| 2016 | $2,761 | $172,500 | $21,100 | $151,400 |
| 2015 | $2,613 | $172,500 | $21,100 | $151,400 |
| 2014 | -- | $163,000 | $21,100 | $141,900 |
Source: Public Records
Map
Nearby Homes
- 3435 Elliot Ave
- 3429 5th Ave S
- 3316 5th Ave S
- 624 E 36th St
- 3129 Oakland Ave
- 3136 10th Ave S
- 3204 5th Ave S
- 3621 Elliot Ave
- 3048 Columbus Ave
- 3025 Park Ave
- 3305 3rd Ave S
- 3116 12th Ave S Unit A106
- 3116 12th Ave S Unit A105
- 3710 Chicago Ave
- 3024 Portland Ave
- 1216 Powderhorn Terrace Unit 15
- 3232 3rd Ave S
- 3241 2nd Ave S
- 1300 Powderhorn Terrace Unit 28
- 3148 3rd Ave S
- 3323 Columbus Ave
- 3329 Columbus Ave
- 3319 Columbus Ave
- 3335 Columbus Ave
- 3315 Columbus Ave
- 3339 Columbus Ave
- 3339 Columbus Ave S
- 3326 Chicago Ave
- 3330 Chicago Ave
- 3322 Chicago Ave Unit 5
- 3322 Chicago Ave Unit 4
- 3322 Chicago Ave Unit 3
- 3322 Chicago Ave Unit 2
- 3322 Chicago Ave Unit 1
- 3322 Chicago Ave
- 3322 Chicago Ave
- 3313 Columbus Ave S
- 3313 Columbus Ave
- 3316 Chicago Ave
- 3326 Columbus Ave