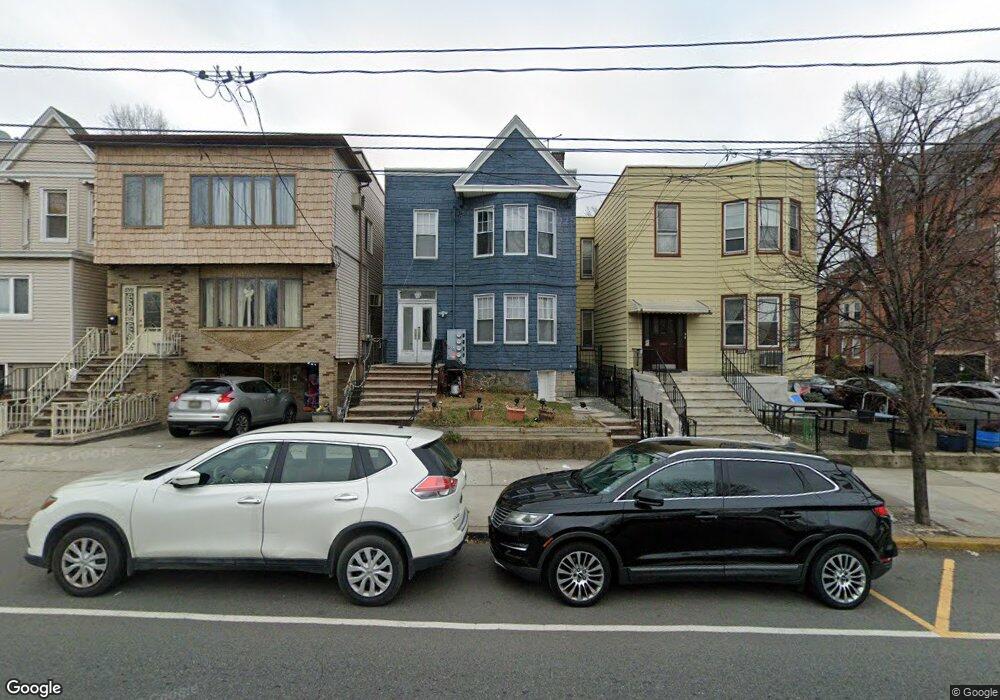
3326 John F. Kennedy Blvd Jersey City, NJ 07307
The Heights NeighborhoodEstimated Value: $968,000 - $1,074,000
--
Bed
--
Bath
1,968
Sq Ft
$512/Sq Ft
Est. Value
About This Home
This home is located at 3326 John F. Kennedy Blvd, Jersey City, NJ 07307 and is currently estimated at $1,007,667, approximately $512 per square foot. 3326 John F. Kennedy Blvd is a home located in Hudson County with nearby schools including Nicolas Copernicus No. 25 Elementary School, William L. Dickinson High School, and Liberty High School.
Ownership History
Date
Name
Owned For
Owner Type
Purchase Details
Closed on
Jul 26, 2019
Sold by
Singh Inderjit and Signh Inderjit
Bought by
3326 Jfkennedy Llc
Current Estimated Value
Home Financials for this Owner
Home Financials are based on the most recent Mortgage that was taken out on this home.
Original Mortgage
$550,000
Interest Rate
3.73%
Mortgage Type
Commercial
Purchase Details
Closed on
May 24, 2018
Sold by
Chavez Maria and Ekmekjian Maria
Bought by
Signh Inderjit
Purchase Details
Closed on
Sep 30, 2005
Sold by
Marola Adele
Bought by
Ekmekjian Maria
Home Financials for this Owner
Home Financials are based on the most recent Mortgage that was taken out on this home.
Original Mortgage
$352,000
Interest Rate
7.5%
Mortgage Type
Unknown
Create a Home Valuation Report for This Property
The Home Valuation Report is an in-depth analysis detailing your home's value as well as a comparison with similar homes in the area
Home Values in the Area
Average Home Value in this Area
Purchase History
| Date | Buyer | Sale Price | Title Company |
|---|---|---|---|
| 3326 Jfkennedy Llc | -- | None Available | |
| 3326 Jfkennedy Llc | -- | None Available | |
| Signh Inderjit | $360,000 | Stewart Title Guaranty Co | |
| Ekmekjian Maria | $440,000 | New Vision Title Agency |
Source: Public Records
Mortgage History
| Date | Status | Borrower | Loan Amount |
|---|---|---|---|
| Previous Owner | 3326 Jfkennedy Llc | $550,000 | |
| Previous Owner | Ekmekjian Maria | $352,000 | |
| Previous Owner | Ekmekjian Maria | $88,000 |
Source: Public Records
Tax History Compared to Growth
Tax History
| Year | Tax Paid | Tax Assessment Tax Assessment Total Assessment is a certain percentage of the fair market value that is determined by local assessors to be the total taxable value of land and additions on the property. | Land | Improvement |
|---|---|---|---|---|
| 2025 | $16,468 | $737,500 | $191,300 | $546,200 |
| 2024 | $16,572 | $737,500 | $191,300 | $546,200 |
| 2023 | $16,572 | $737,500 | $191,300 | $546,200 |
| 2022 | $15,620 | $737,500 | $191,300 | $546,200 |
| 2021 | $11,830 | $737,500 | $191,300 | $546,200 |
| 2020 | $11,874 | $737,500 | $191,300 | $546,200 |
| 2019 | $6,619 | $429,800 | $191,300 | $238,500 |
| 2018 | $1,786 | $429,800 | $191,300 | $238,500 |
| 2017 | $9,360 | $120,000 | $20,000 | $100,000 |
| 2016 | $9,241 | $120,000 | $20,000 | $100,000 |
| 2015 | $8,978 | $120,000 | $20,000 | $100,000 |
| 2014 | $8,921 | $120,000 | $20,000 | $100,000 |
Source: Public Records
Map
Nearby Homes
- 1512 Manhattan Ave
- 93 Sherman Place
- 91 Sherman Place
- 310 Liberty Ave
- 87 Sherman Place
- 54 Montrose Ave
- 259 Liberty Ave Unit 3
- 259 Liberty Ave Unit 1
- 259 Liberty Ave Unit 2
- 259 Liberty Ave Unit 4
- 203 Hutton St Unit 2
- 83 Sherman Place
- 131 Zabriskie St Unit 1
- 77 Sherman Place Unit 3
- 77 Sherman Place Unit 1
- 40 Terrace Ave
- 113 Zabriskie St Unit 2
- 133 Beach St
- 74 Sherman Place
- 63 Sherman Place Unit E1
- 3324 John Fitzgerald Kennedy Blvd
- 3324 John Fitzgerald Kennedy Blvd Unit 3
- 3326 John Fitzgerald Kennedy Blvd
- 3324 John F. Kennedy Blvd
- 3324 John F. Kennedy Blvd Unit 2
- 3328 John F. Kennedy Blvd
- 3330 John F. Kennedy Blvd
- 3328 John Fitzgerald Kennedy Blvd
- 136 Sherman Place
- 136 Sherman Place Unit 2
- 134 Sherman Place
- 3332 John F. Kennedy Blvd Unit 1
- 3332 John F. Kennedy Blvd
- 3332 John Fitzgerald Kennedy Blvd
- 3316 John Fitzgerald Kennedy Blvd
- 3316 Kennedy Blvd Unit 304
- 3316 Kennedy Blvd Unit 203
- 3316 Kennedy Blvd Unit 401
- 3316 Kennedy Blvd Unit 202
- 3316 Kennedy Blvd Unit 301