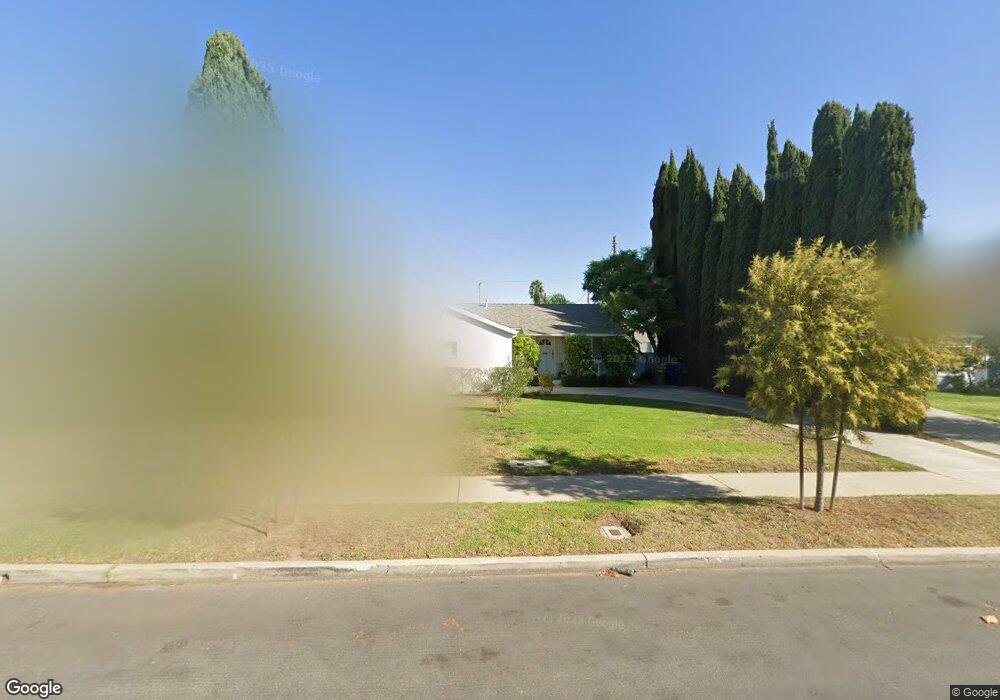
3328 Cabrillo Blvd Los Angeles, CA 90066
Mar Vista NeighborhoodEstimated Value: $1,481,000 - $1,741,000
2
Beds
1
Bath
864
Sq Ft
$1,890/Sq Ft
Est. Value
About This Home
This home is located at 3328 Cabrillo Blvd, Los Angeles, CA 90066 and is currently estimated at $1,632,938, approximately $1,889 per square foot. 3328 Cabrillo Blvd is a home located in Los Angeles County with nearby schools including Walgrove Avenue Elementary, Mark Twain Middle School, and Venice High School.
Ownership History
Date
Name
Owned For
Owner Type
Purchase Details
Closed on
Nov 22, 2024
Sold by
Andrews Tina Coulter
Bought by
Tina Coulter Andrews Living Trust and Andrews
Current Estimated Value
Purchase Details
Closed on
Jan 5, 2015
Sold by
Andrews Robert C
Bought by
Andrews Tina C
Purchase Details
Closed on
Feb 26, 1999
Sold by
Andrews Robert C and Andrews Tina C
Bought by
Andrews Robert C
Home Financials for this Owner
Home Financials are based on the most recent Mortgage that was taken out on this home.
Original Mortgage
$235,000
Interest Rate
6.76%
Purchase Details
Closed on
May 7, 1996
Sold by
Young Alexander S
Bought by
Andrews Robert C and Coulter Tina L
Home Financials for this Owner
Home Financials are based on the most recent Mortgage that was taken out on this home.
Original Mortgage
$233,750
Interest Rate
7.37%
Create a Home Valuation Report for This Property
The Home Valuation Report is an in-depth analysis detailing your home's value as well as a comparison with similar homes in the area
Home Values in the Area
Average Home Value in this Area
Purchase History
| Date | Buyer | Sale Price | Title Company |
|---|---|---|---|
| Tina Coulter Andrews Living Trust | -- | None Listed On Document | |
| Tina Coulter Andrews Living Trust | -- | None Listed On Document | |
| Andrews Tina C | -- | Accommodation | |
| Andrews Robert C | -- | Fidelity National Title Co | |
| Andrews Robert C | $275,000 | Gateway Title Company |
Source: Public Records
Mortgage History
| Date | Status | Borrower | Loan Amount |
|---|---|---|---|
| Previous Owner | Andrews Robert C | $235,000 | |
| Previous Owner | Andrews Robert C | $233,750 |
Source: Public Records
Tax History Compared to Growth
Tax History
| Year | Tax Paid | Tax Assessment Tax Assessment Total Assessment is a certain percentage of the fair market value that is determined by local assessors to be the total taxable value of land and additions on the property. | Land | Improvement |
|---|---|---|---|---|
| 2025 | $5,467 | $456,822 | $382,079 | $74,743 |
| 2024 | $5,467 | $447,866 | $374,588 | $73,278 |
| 2023 | $5,364 | $439,086 | $367,244 | $71,842 |
| 2022 | $5,117 | $430,478 | $360,044 | $70,434 |
| 2021 | $5,050 | $422,038 | $352,985 | $69,053 |
| 2019 | $4,897 | $409,521 | $342,516 | $67,005 |
| 2018 | $4,846 | $401,492 | $335,800 | $65,692 |
| 2016 | $4,631 | $385,903 | $322,761 | $63,142 |
| 2015 | $4,563 | $380,107 | $317,913 | $62,194 |
| 2014 | $4,585 | $372,662 | $311,686 | $60,976 |
Source: Public Records
Map
Nearby Homes
- 3379 Stewart Ave
- 3362 Rosewood Ave
- 12566 Preston Way
- 3402 S Centinela Ave
- 12317 Navy St
- 13023 Warren Ave
- 13053 Rose Ave
- 13025 Dewey St
- 3460 S Centinela Ave Unit 505
- 13137 Warren Ave
- 12118 Navy St
- 12413 Westminster Ave
- 13222 Rose Ave
- 3470 Grand View Blvd
- 3524 Grand View Blvd
- 3508 Ashwood Ave
- 0 Wade St
- 2408 Pier Ave
- 1531 Glencoe Ave
- 11931 Lawler St
- 3334 Cabrillo Blvd
- 3320 Cabrillo Blvd
- 3337 Wade St
- 3338 Cabrillo Blvd
- 3316 Cabrillo Blvd
- 3343 Wade St
- 3331 Wade St
- 3329 Cabrillo Blvd
- 3347 Wade St
- 3344 Cabrillo Blvd
- 3335 Cabrillo Blvd
- 3310 Cabrillo Blvd
- 3317 Cabrillo Blvd
- 3337 Cabrillo Blvd
- 3355 Wade St
- 3311 Cabrillo Blvd
- 12680 Rose Ave
- 3300 Cabrillo Blvd
- 3350 Cabrillo Blvd