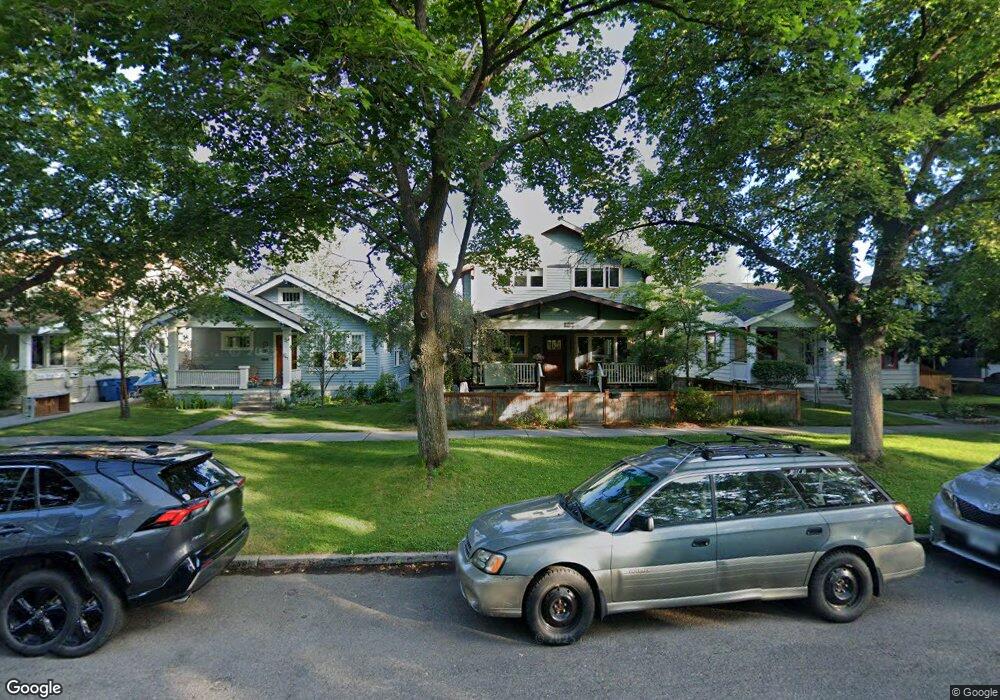
333 Blaine St Missoula, MT 59801
Rose Park NeighborhoodEstimated Value: $790,000 - $984,706
5
Beds
3
Baths
2,144
Sq Ft
$398/Sq Ft
Est. Value
About This Home
This home is located at 333 Blaine St, Missoula, MT 59801 and is currently estimated at $853,927, approximately $398 per square foot. 333 Blaine St is a home located in Missoula County with nearby schools including Paxson School, Washington Middle School, and Hellgate High School.
Ownership History
Date
Name
Owned For
Owner Type
Purchase Details
Closed on
Jul 14, 2022
Sold by
Bay Mcgahan Romy
Bought by
Mcgahan Romy Bay and Smith Marvin K
Current Estimated Value
Home Financials for this Owner
Home Financials are based on the most recent Mortgage that was taken out on this home.
Original Mortgage
$460,000
Outstanding Balance
$437,638
Interest Rate
5.09%
Mortgage Type
Balloon
Estimated Equity
$416,289
Purchase Details
Closed on
Sep 17, 2021
Sold by
Daniel Suresh K
Bought by
Daniel Suresh K and Daniel Romy Mcgahan
Purchase Details
Closed on
Aug 14, 2001
Sold by
Supplee Katherine Ann
Bought by
Daniel Suresh K
Home Financials for this Owner
Home Financials are based on the most recent Mortgage that was taken out on this home.
Original Mortgage
$166,250
Interest Rate
7.19%
Create a Home Valuation Report for This Property
The Home Valuation Report is an in-depth analysis detailing your home's value as well as a comparison with similar homes in the area
Home Values in the Area
Average Home Value in this Area
Purchase History
| Date | Buyer | Sale Price | Title Company |
|---|---|---|---|
| Mcgahan Romy Bay | -- | Title Services | |
| Mcgahan Romy Bay | -- | Title Services | |
| Daniel Suresh K | -- | None Available | |
| Daniel Suresh K | -- | -- |
Source: Public Records
Mortgage History
| Date | Status | Borrower | Loan Amount |
|---|---|---|---|
| Open | Mcgahan Romy Bay | $460,000 | |
| Previous Owner | Daniel Suresh K | $166,250 |
Source: Public Records
Tax History Compared to Growth
Tax History
| Year | Tax Paid | Tax Assessment Tax Assessment Total Assessment is a certain percentage of the fair market value that is determined by local assessors to be the total taxable value of land and additions on the property. | Land | Improvement |
|---|---|---|---|---|
| 2025 | $9,868 | $944,400 | $311,870 | $632,530 |
| 2024 | $9,361 | $769,200 | $217,230 | $551,970 |
| 2023 | $9,136 | $769,200 | $217,230 | $551,970 |
| 2022 | $7,649 | $557,000 | $0 | $0 |
| 2021 | $7,273 | $557,000 | $0 | $0 |
| 2020 | $5,557 | $414,600 | $0 | $0 |
| 2019 | $5,542 | $414,600 | $0 | $0 |
| 2018 | $5,949 | $418,420 | $0 | $0 |
| 2017 | $5,013 | $418,420 | $0 | $0 |
| 2016 | $5,076 | $390,330 | $0 | $0 |
| 2015 | $4,730 | $390,330 | $0 | $0 |
| 2014 | $3,892 | $179,090 | $0 | $0 |
Source: Public Records
Map
Nearby Homes
- 1325 Gerald Ave
- 603 Brooks St
- 225 Eddy Ave
- 300 Connell Ave
- 320 S 6th St E
- 120 S 4th St W Unit 4 and 6
- 415 S 6th St E
- 125 W Franklin St
- 455 Mount Ave
- 808 Ash St
- 520 Hickory St
- 542 Eddy Ave
- 540 S 6th St E
- 470 Strand Ave
- 516 S 5th St E
- 512 S 2nd St W
- 722 Oak St
- 401 Woodworth Ave
- 546 Woodworth Ave
- 1105 Stephens Ave Unit 1