Estimated Value: $64,000 - $168,000
2
Beds
2
Baths
800
Sq Ft
$125/Sq Ft
Est. Value
About This Home
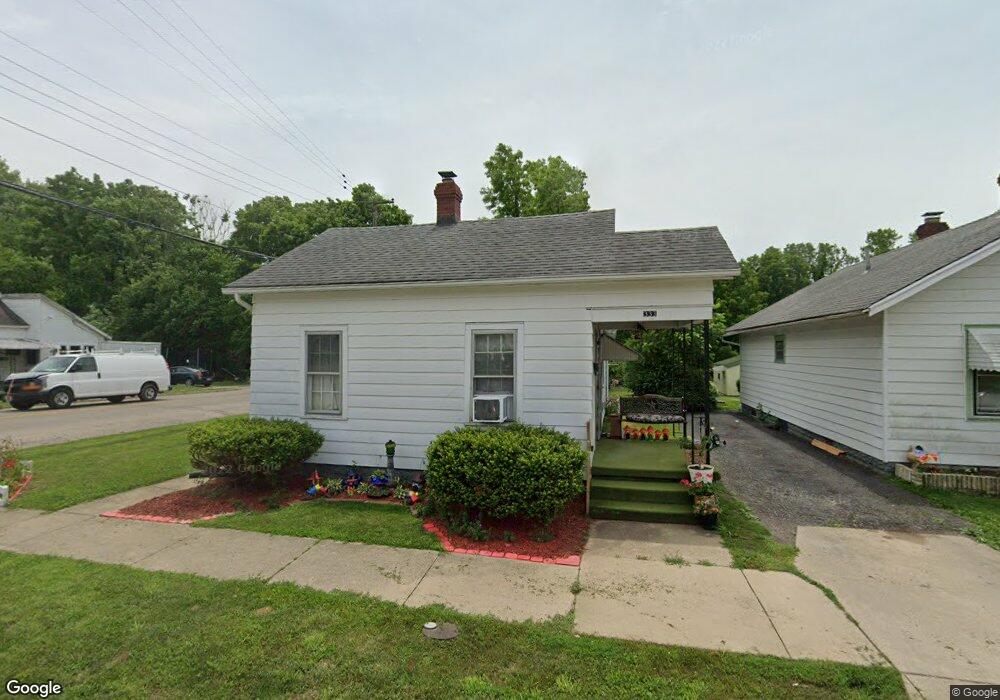
This home is located at 333 E 3rd St, Xenia, OH 45385 and is currently estimated at $100,140, approximately $125 per square foot. 333 E 3rd St is a home located in Greene County with nearby schools including Xenia High School, Summit Academy Community School for Alternative Learners - Xenia, and Legacy Christian Academy.
Ownership History
Date
Name
Owned For
Owner Type
Purchase Details
Closed on
Sep 16, 2022
Sold by
Sutton Joshua J and Sutton Amber N
Bought by
Nantucket Estates Llc
Current Estimated Value
Purchase Details
Closed on
Jul 26, 2019
Sold by
Secretary Of Veterans Affairs
Bought by
Sutton Joshua J
Purchase Details
Closed on
Jun 10, 2019
Sold by
The Huntington National Bank
Bought by
Secretary Of Veterans Affairs
Purchase Details
Closed on
May 6, 2019
Sold by
Smith Cheryl A
Bought by
The Huntington National Bank
Purchase Details
Closed on
Oct 26, 2016
Bought by
Cloud Joe L
Home Financials for this Owner
Home Financials are based on the most recent Mortgage that was taken out on this home.
Interest Rate
3.52%
Purchase Details
Closed on
Jun 13, 2016
Sold by
Cloud Joe L
Bought by
Banks Rhuben
Home Financials for this Owner
Home Financials are based on the most recent Mortgage that was taken out on this home.
Original Mortgage
$33,198
Interest Rate
4.03%
Mortgage Type
VA
Create a Home Valuation Report for This Property
The Home Valuation Report is an in-depth analysis detailing your home's value as well as a comparison with similar homes in the area
Home Values in the Area
Average Home Value in this Area
Purchase History
| Date | Buyer | Sale Price | Title Company |
|---|---|---|---|
| Nantucket Estates Llc | -- | None Listed On Document | |
| Sutton Joshua J | -- | None Available | |
| Secretary Of Veterans Affairs | -- | None Available | |
| The Huntington National Bank | $22,000 | None Available | |
| Cloud Joe L | $49,000 | -- | |
| Banks Rhuben | -- | None Available |
Source: Public Records
Mortgage History
| Date | Status | Borrower | Loan Amount |
|---|---|---|---|
| Previous Owner | Cloud Joe L | -- | |
| Previous Owner | Banks Rhuben | $33,198 |
Source: Public Records
Tax History
| Year | Tax Paid | Tax Assessment Tax Assessment Total Assessment is a certain percentage of the fair market value that is determined by local assessors to be the total taxable value of land and additions on the property. | Land | Improvement |
|---|---|---|---|---|
| 2024 | $872 | $20,030 | $4,510 | $15,520 |
| 2023 | $857 | $20,030 | $4,510 | $15,520 |
| 2022 | $758 | $15,100 | $3,610 | $11,490 |
| 2021 | $768 | $15,100 | $3,610 | $11,490 |
| 2020 | $668 | $15,100 | $3,610 | $11,490 |
| 2019 | $668 | $12,910 | $3,200 | $9,710 |
| 2018 | $210 | $12,910 | $3,200 | $9,710 |
| 2017 | $204 | $12,910 | $3,200 | $9,710 |
| 2016 | $670 | $12,660 | $2,940 | $9,720 |
| 2015 | $353 | $12,660 | $2,940 | $9,720 |
| 2014 | $644 | $12,660 | $2,940 | $9,720 |
Source: Public Records
Map
Nearby Homes
Your Personal Tour Guide
Ask me questions while you tour the home.