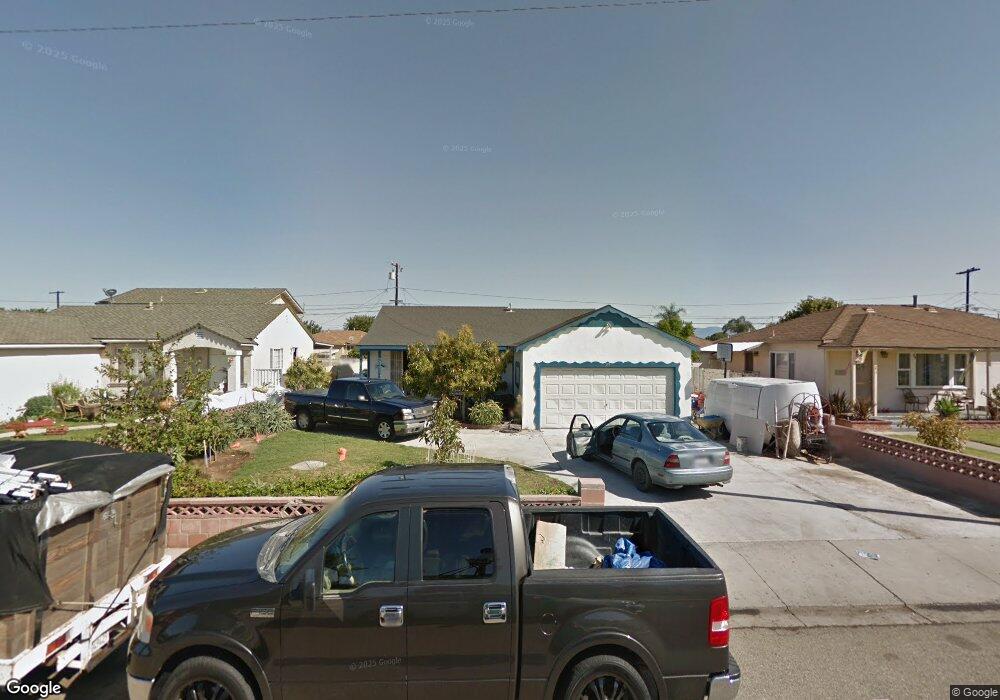
333 E Guava St Oxnard, CA 93033
Cal-Gisler NeighborhoodEstimated Value: $584,000 - $722,000
5
Beds
2
Baths
1,032
Sq Ft
$633/Sq Ft
Est. Value
About This Home
This home is located at 333 E Guava St, Oxnard, CA 93033 and is currently estimated at $653,711, approximately $633 per square foot. 333 E Guava St is a home located in Ventura County with nearby schools including Elm Street Elementary School, R.J. Frank Academy of Marine Science & Engineering, and Santa Clara High School.
Ownership History
Date
Name
Owned For
Owner Type
Purchase Details
Closed on
Oct 10, 2019
Sold by
Perez Jose J
Bought by
The Perez Garcia Family Trust
Current Estimated Value
Purchase Details
Closed on
Nov 7, 2001
Sold by
Perez Victoria H
Bought by
Perez Jose J
Purchase Details
Closed on
Feb 1, 2001
Sold by
Garcia Victoria H
Bought by
Perez Jose J
Create a Home Valuation Report for This Property
The Home Valuation Report is an in-depth analysis detailing your home's value as well as a comparison with similar homes in the area
Home Values in the Area
Average Home Value in this Area
Purchase History
| Date | Buyer | Sale Price | Title Company |
|---|---|---|---|
| The Perez Garcia Family Trust | -- | None Available | |
| Perez Jose J | -- | -- | |
| Perez Jose J | -- | -- |
Source: Public Records
Tax History
| Year | Tax Paid | Tax Assessment Tax Assessment Total Assessment is a certain percentage of the fair market value that is determined by local assessors to be the total taxable value of land and additions on the property. | Land | Improvement |
|---|---|---|---|---|
| 2025 | $2,574 | $209,437 | $61,475 | $147,962 |
| 2024 | $2,574 | $205,331 | $60,270 | $145,061 |
| 2023 | $2,481 | $201,305 | $59,088 | $142,217 |
| 2022 | $2,408 | $197,358 | $57,929 | $139,429 |
| 2021 | $2,389 | $193,489 | $56,793 | $136,696 |
| 2020 | $2,432 | $191,507 | $56,211 | $135,296 |
| 2019 | $2,278 | $187,753 | $55,109 | $132,644 |
| 2018 | $2,245 | $184,073 | $54,029 | $130,044 |
| 2017 | $2,130 | $180,465 | $52,970 | $127,495 |
| 2016 | $2,055 | $176,928 | $51,932 | $124,996 |
| 2015 | $2,076 | $174,271 | $51,152 | $123,119 |
| 2014 | $2,051 | $170,859 | $50,151 | $120,708 |
Source: Public Records
Map
Nearby Homes
- 225 W Iris St
- 1239 S C St
- 3151 Fournier St
- 2024 S J St
- 3130 Paula St
- 1127 S C St
- 865 S B St Unit Q1
- 3631 La Costa Place
- 819 S B St Unit 34
- 2151 E Wooley Rd
- 3638 S B St
- 633 Meta St
- 860 Morro Way
- 1030 Ilena St
- 360 Ibsen Place Unit 129
- 1928 San Benito St
- 140 Gaviota Place Unit 157
- 1140 Teakwood St
- 1431 Casa San Carlos Ln Unit B
- 4160 Petit Dr Unit 39
Your Personal Tour Guide
Ask me questions while you tour the home.