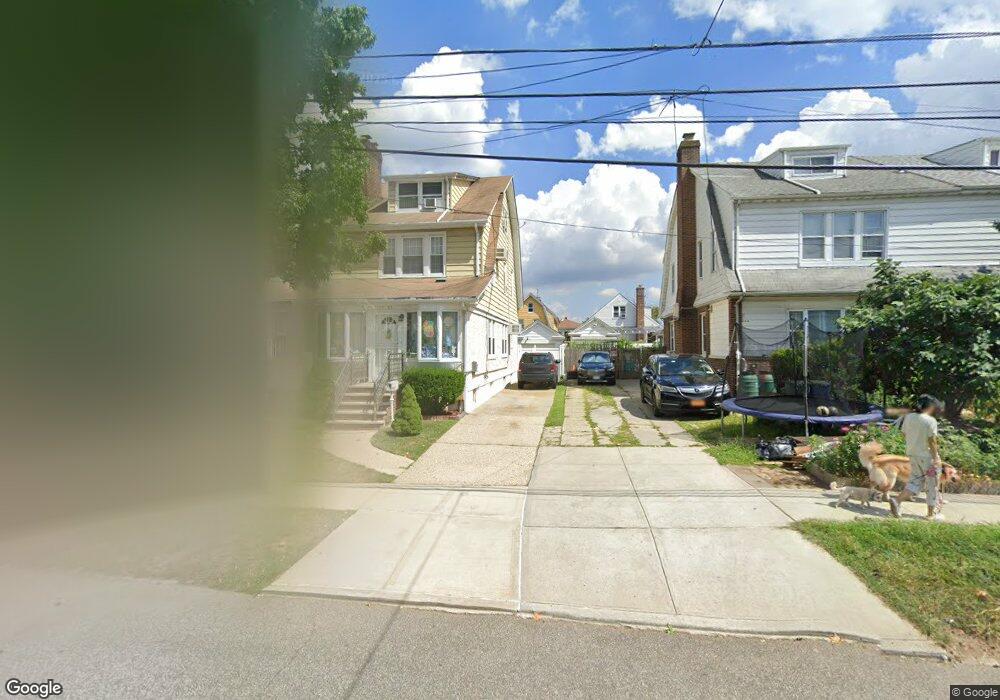
3333 155th St Flushing, NY 11354
Murray Hill-Broadway NeighborhoodEstimated Value: $1,053,931 - $1,239,000
5
Beds
2
Baths
1,764
Sq Ft
$631/Sq Ft
Est. Value
About This Home
This home is located at 3333 155th St, Flushing, NY 11354 and is currently estimated at $1,112,233, approximately $630 per square foot. 3333 155th St is a home located in Queens County with nearby schools including P.S. 32 - State Street, I.S. 25 Adrien Block, and Francis Lewis High School.
Ownership History
Date
Name
Owned For
Owner Type
Purchase Details
Closed on
Jan 30, 1998
Sold by
Magic Of Great Neck Realty Inc
Bought by
Newman Nicole
Current Estimated Value
Home Financials for this Owner
Home Financials are based on the most recent Mortgage that was taken out on this home.
Original Mortgage
$227,150
Interest Rate
7.03%
Purchase Details
Closed on
Jul 11, 1997
Sold by
Retained Realty Inc
Bought by
Magic Of Great Neck Realty Inc
Home Financials for this Owner
Home Financials are based on the most recent Mortgage that was taken out on this home.
Original Mortgage
$133,600
Interest Rate
16%
Create a Home Valuation Report for This Property
The Home Valuation Report is an in-depth analysis detailing your home's value as well as a comparison with similar homes in the area
Home Values in the Area
Average Home Value in this Area
Purchase History
| Date | Buyer | Sale Price | Title Company |
|---|---|---|---|
| Newman Nicole | $252,500 | -- | |
| Magic Of Great Neck Realty Inc | $167,000 | -- |
Source: Public Records
Mortgage History
| Date | Status | Borrower | Loan Amount |
|---|---|---|---|
| Previous Owner | Newman Nicole | $227,150 | |
| Previous Owner | Magic Of Great Neck Realty Inc | $133,600 |
Source: Public Records
Tax History
| Year | Tax Paid | Tax Assessment Tax Assessment Total Assessment is a certain percentage of the fair market value that is determined by local assessors to be the total taxable value of land and additions on the property. | Land | Improvement |
|---|---|---|---|---|
| 2025 | $7,168 | $36,617 | $10,292 | $26,325 |
| 2024 | $7,168 | $35,686 | $10,160 | $25,526 |
| 2023 | $6,822 | $33,966 | $8,484 | $25,482 |
| 2022 | $5,316 | $62,940 | $17,100 | $45,840 |
| 2021 | $5,302 | $57,900 | $17,100 | $40,800 |
| 2020 | $5,337 | $58,200 | $17,100 | $41,100 |
| 2019 | $6,221 | $57,540 | $17,100 | $40,440 |
| 2018 | $5,770 | $28,305 | $8,099 | $20,206 |
| 2017 | $5,478 | $26,872 | $9,183 | $17,689 |
| 2016 | $5,085 | $26,872 | $9,183 | $17,689 |
| 2015 | $3,058 | $25,428 | $12,382 | $13,046 |
| 2014 | $3,058 | $24,782 | $12,900 | $11,882 |
Source: Public Records
Map
Nearby Homes
- 33-19 155th St
- 32-24 157th St
- 3307 153rd St
- 32-20 156th St
- 33-38 153rd St
- 3226 158th St
- 35-35 155th St
- 153-06 32nd Ave
- 151-08 33rd Rd
- 3425 150th Place Unit 6E
- 34-25 150th Place Unit 3E
- 40-11 157th St
- 32-15 Murray Ln
- 3326 162nd St
- 32-15 161st St
- 28-14 157th St
- 2934 161st St
- 15002 Northern Blvd Unit 4B
- 15002 Northern Blvd Unit 6G
- 15002 Northern Blvd Unit 5H
Your Personal Tour Guide
Ask me questions while you tour the home.