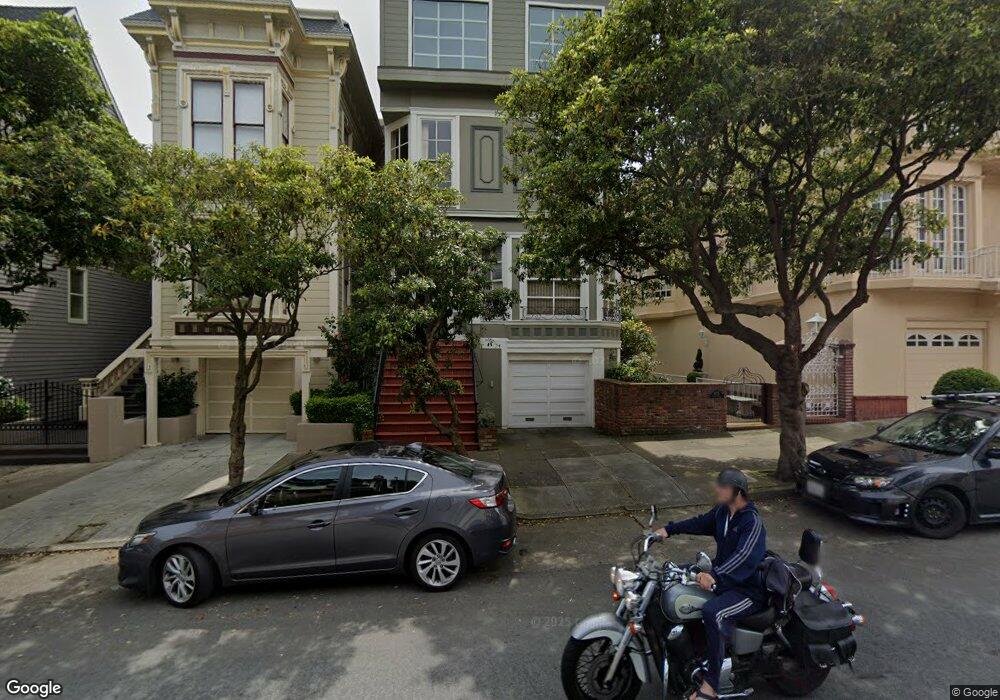
3333 Clay St Unit 1 San Francisco, CA 94118
Presidio Heights NeighborhoodEstimated Value: $1,049,260 - $2,222,000
1
Bed
1
Bath
1,000
Sq Ft
$1,558/Sq Ft
Est. Value
About This Home
This home is located at 3333 Clay St Unit 1, San Francisco, CA 94118 and is currently estimated at $1,557,565, approximately $1,557 per square foot. 3333 Clay St Unit 1 is a home located in San Francisco County with nearby schools including Sutro Elementary School, Roosevelt Middle School, and Presidio Hill School.
Ownership History
Date
Name
Owned For
Owner Type
Purchase Details
Closed on
Oct 15, 2002
Sold by
Bellisimo Louise
Bought by
Dewell Heidi K
Current Estimated Value
Home Financials for this Owner
Home Financials are based on the most recent Mortgage that was taken out on this home.
Original Mortgage
$604,000
Outstanding Balance
$231,683
Interest Rate
5%
Estimated Equity
$1,325,882
Purchase Details
Closed on
Feb 8, 1999
Sold by
Nygren David J
Bought by
Bellisimo Louise
Home Financials for this Owner
Home Financials are based on the most recent Mortgage that was taken out on this home.
Original Mortgage
$241,000
Interest Rate
6.77%
Purchase Details
Closed on
Jul 31, 1996
Sold by
Colton Laurence Alan and Laurence Alan Colton Trust
Bought by
Nygren David J
Home Financials for this Owner
Home Financials are based on the most recent Mortgage that was taken out on this home.
Original Mortgage
$309,600
Interest Rate
8.33%
Purchase Details
Closed on
May 17, 1994
Sold by
Colton Laurence Alan
Bought by
Colton Laurence Alan
Create a Home Valuation Report for This Property
The Home Valuation Report is an in-depth analysis detailing your home's value as well as a comparison with similar homes in the area
Home Values in the Area
Average Home Value in this Area
Purchase History
| Date | Buyer | Sale Price | Title Company |
|---|---|---|---|
| Dewell Heidi K | $755,000 | First American Title Company | |
| Bellisimo Louise | $551,000 | Fidelity National Title Co | |
| Nygren David J | $387,000 | Fidelity National Title Co | |
| Colton Laurence Alan | -- | -- |
Source: Public Records
Mortgage History
| Date | Status | Borrower | Loan Amount |
|---|---|---|---|
| Open | Dewell Heidi K | $604,000 | |
| Previous Owner | Bellisimo Louise | $241,000 | |
| Previous Owner | Nygren David J | $309,600 | |
| Closed | Dewell Heidi K | $75,500 |
Source: Public Records
Tax History Compared to Growth
Tax History
| Year | Tax Paid | Tax Assessment Tax Assessment Total Assessment is a certain percentage of the fair market value that is determined by local assessors to be the total taxable value of land and additions on the property. | Land | Improvement |
|---|---|---|---|---|
| 2025 | $13,437 | $1,093,472 | $546,736 | $546,736 |
| 2024 | $13,437 | $1,072,032 | $536,016 | $536,016 |
| 2023 | $13,436 | $1,051,012 | $525,506 | $525,506 |
| 2022 | $13,132 | $1,030,404 | $515,202 | $515,202 |
| 2021 | $12,902 | $1,010,200 | $505,100 | $505,100 |
| 2020 | $12,965 | $999,842 | $499,921 | $499,921 |
| 2019 | $12,532 | $980,238 | $490,119 | $490,119 |
| 2018 | $11,902 | $961,018 | $480,509 | $480,509 |
| 2017 | $11,464 | $942,176 | $471,088 | $471,088 |
| 2016 | $11,270 | $923,702 | $461,851 | $461,851 |
| 2015 | $11,131 | $909,828 | $454,914 | $454,914 |
| 2014 | $10,839 | $892,006 | $446,003 | $446,003 |
Source: Public Records
Map
Nearby Homes
- 333 Presidio Ave Unit 5
- 3332 Washington St
- 1819 Lyon St Unit 3
- 1819 Lyon St Unit 1
- 3100 California St
- 3315 Jackson St
- 440 Laurel St
- 436a Laurel St
- 315 Laurel St
- 3515 Sacramento St
- 3014 Pine St
- 3014 Pine St Unit A
- 3124 Washington St
- 2978 Pine St
- 3561 Sacramento St Unit A
- 3062 Jackson St
- 1910 Baker St
- 3583 Sacramento St
- 2990 Jackson St Unit 4
- 2033 Broderick St
- 3333 Clay St Unit 3
- 3333 Clay St Unit 2
- 3329 Clay St
- 3335 Clay St Unit 3335
- 3323 Clay St
- 3351 Clay St Unit 3
- 3351 Clay St Unit 2
- 3351 Clay St Unit 1
- 3351 Clay St
- 3319 Clay St
- 3365 Clay St
- 343 Presidio Ave Unit 343
- 341 Presidio Ave
- 339 Presidio Ave
- 323 Presidio Ave
- 3369 Clay St
- 3350 Sacramento St Unit 3352
- 333 Presidio Ave Unit 6
- 333 Presidio Ave Unit 4
- 333 Presidio Ave Unit 3