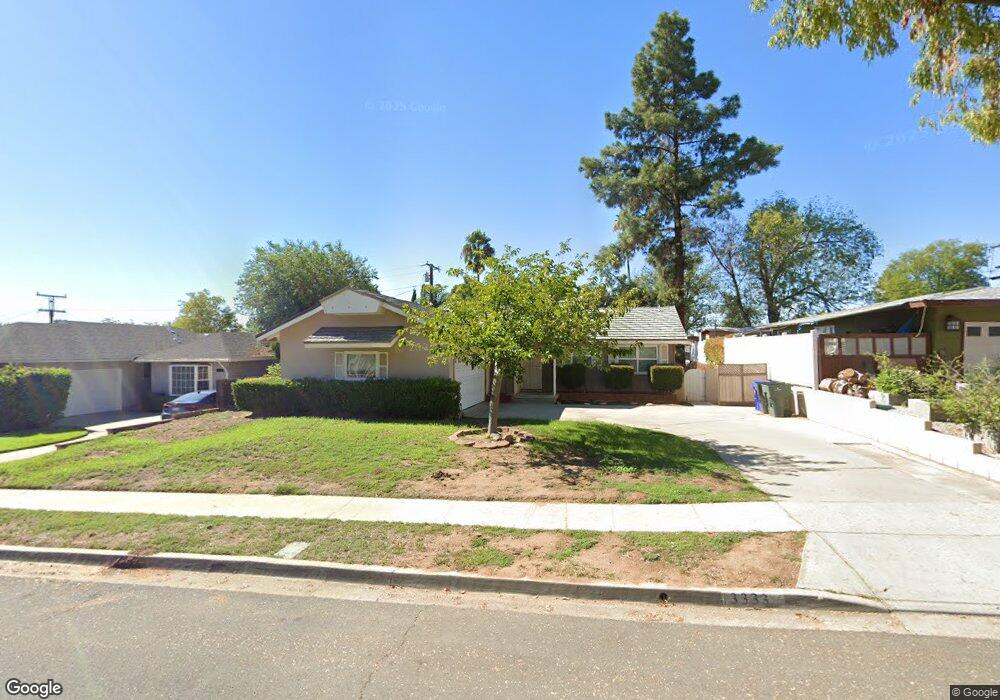
3333 Inverness St Riverside, CA 92507
University NeighborhoodEstimated Value: $556,309 - $651,000
4
Beds
2
Baths
1,314
Sq Ft
$456/Sq Ft
Est. Value
About This Home
This home is located at 3333 Inverness St, Riverside, CA 92507 and is currently estimated at $598,827, approximately $455 per square foot. 3333 Inverness St is a home located in Riverside County with nearby schools including Highland Elementary, University Heights Middle School, and John W. North High School.
Ownership History
Date
Name
Owned For
Owner Type
Purchase Details
Closed on
Jun 8, 2011
Sold by
Beneficial Financial I Inc
Bought by
Lu Yanbing and Chen Rui
Current Estimated Value
Purchase Details
Closed on
Mar 11, 2011
Sold by
Lugo Victor and Lugo Patsy
Bought by
Beneficial Financial I Inc
Purchase Details
Closed on
Aug 15, 2003
Sold by
Ginter Edward A
Bought by
Lugo Victor and Lugo Patsy
Home Financials for this Owner
Home Financials are based on the most recent Mortgage that was taken out on this home.
Original Mortgage
$188,000
Interest Rate
7.5%
Mortgage Type
Purchase Money Mortgage
Purchase Details
Closed on
May 16, 1994
Sold by
Singer Robert D and Hoppe Christiane M
Bought by
Ginter Edward A
Home Financials for this Owner
Home Financials are based on the most recent Mortgage that was taken out on this home.
Original Mortgage
$109,553
Interest Rate
8.6%
Mortgage Type
FHA
Create a Home Valuation Report for This Property
The Home Valuation Report is an in-depth analysis detailing your home's value as well as a comparison with similar homes in the area
Home Values in the Area
Average Home Value in this Area
Purchase History
| Date | Buyer | Sale Price | Title Company |
|---|---|---|---|
| Lu Yanbing | $200,000 | Fidelity National Title Co | |
| Beneficial Financial I Inc | $195,583 | Accommodation | |
| Lugo Victor | $235,000 | Chicago Title Co | |
| Ginter Edward A | $110,000 | Orange Coast Title Co |
Source: Public Records
Mortgage History
| Date | Status | Borrower | Loan Amount |
|---|---|---|---|
| Previous Owner | Lugo Victor | $188,000 | |
| Previous Owner | Ginter Edward A | $109,553 | |
| Closed | Lugo Victor | $47,000 |
Source: Public Records
Tax History Compared to Growth
Tax History
| Year | Tax Paid | Tax Assessment Tax Assessment Total Assessment is a certain percentage of the fair market value that is determined by local assessors to be the total taxable value of land and additions on the property. | Land | Improvement |
|---|---|---|---|---|
| 2025 | $2,815 | $256,220 | $102,485 | $153,735 |
| 2023 | $2,815 | $246,272 | $98,506 | $147,766 |
| 2022 | $2,752 | $241,444 | $96,575 | $144,869 |
| 2021 | $2,725 | $236,711 | $94,682 | $142,029 |
| 2020 | $2,704 | $234,285 | $93,712 | $140,573 |
| 2019 | $2,654 | $229,692 | $91,875 | $137,817 |
| 2018 | $2,603 | $225,189 | $90,075 | $135,114 |
| 2017 | $2,557 | $220,774 | $88,309 | $132,465 |
| 2016 | $2,395 | $216,446 | $86,578 | $129,868 |
| 2015 | $2,361 | $213,197 | $85,279 | $127,918 |
| 2014 | $2,339 | $209,022 | $83,609 | $125,413 |
Source: Public Records
Map
Nearby Homes
- 3378 Mount Vernon Ave
- 138 Green Oaks Dr
- 3386 Somis Dr
- 270 W Blaine St
- 230 E Blaine St
- 3540 Watkins Dr
- 3160 Terrace Dr
- 2935 Galaxie Heights Rd
- 350 Glenhill Dr
- 151 Barret Rd
- 514 Massachusetts Ave
- 2005 Mt Vernon Ave
- 2891 Canyon Crest Dr
- 2891 Canyon Crest Dr Unit 16
- 4530 Watkins Dr
- 895 Huston Dr
- 1031 Athena Ct
- 1050 Athena Ct
- 1114 W Blaine St Unit 108
- 1110 W Blaine St Unit 102
- 3323 Inverness St
- 3345 Inverness St
- 3334 Grampion Rd
- 3324 Grampion Rd
- 3346 Grampion Rd
- 150 W Blaine St
- 3355 Inverness St
- 3334 Inverness St
- 3314 Grampion Rd
- 3324 Inverness St
- 3346 Inverness St
- 3356 Grampion Rd
- 3365 Inverness St
- 3356 Inverness St
- 3366 Grampion Rd
- 3333 Mt Vernon Ave
- 3366 Inverness St
- 3333 Grampion Rd
- 3333 Mount Vernon Ave
- 3323 Grampion Rd