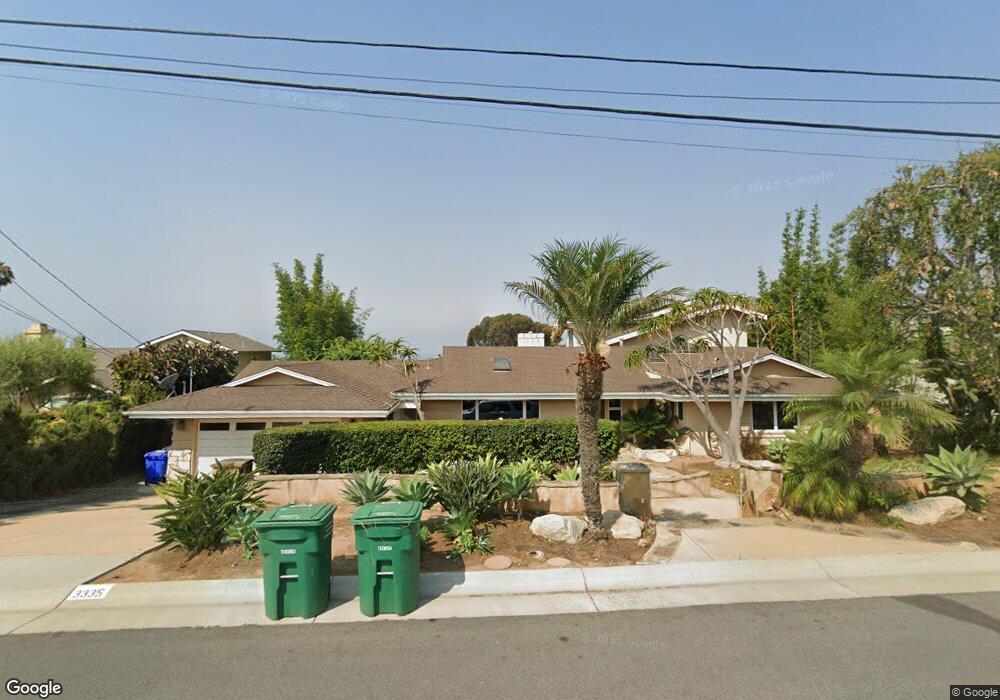
3335 Seacrest Dr Carlsbad, CA 92008
Olde Carlsbad NeighborhoodEstimated Value: $2,144,000 - $2,652,000
6
Beds
6
Baths
3,647
Sq Ft
$652/Sq Ft
Est. Value
About This Home
This home is located at 3335 Seacrest Dr, Carlsbad, CA 92008 and is currently estimated at $2,378,262, approximately $652 per square foot. 3335 Seacrest Dr is a home located in San Diego County with nearby schools including Magnolia Elementary, Carlsbad High School, and Sage Creek High.
Ownership History
Date
Name
Owned For
Owner Type
Purchase Details
Closed on
Oct 2, 2019
Sold by
Kurtz Michael D and Michael D Kurtz Survivor S Tru
Bought by
Kurtzt Michael D and Michael D Kurtz Survivor S Tru
Current Estimated Value
Purchase Details
Closed on
Mar 13, 2015
Sold by
Kurtz Michael D
Bought by
Michael D Kurtz Survivors Trust
Purchase Details
Closed on
Jan 10, 2003
Sold by
Kurtz Michael D and Kurtz Rosario R
Bought by
Kurtz Michael D and Kurtz Rosario R
Home Financials for this Owner
Home Financials are based on the most recent Mortgage that was taken out on this home.
Original Mortgage
$300,000
Interest Rate
5.39%
Purchase Details
Closed on
Dec 31, 2002
Sold by
Kurtz Michael D and Kurtz Rosario R
Bought by
Kurtz Michael D and Kurtz Rosario R
Home Financials for this Owner
Home Financials are based on the most recent Mortgage that was taken out on this home.
Original Mortgage
$300,000
Interest Rate
5.39%
Create a Home Valuation Report for This Property
The Home Valuation Report is an in-depth analysis detailing your home's value as well as a comparison with similar homes in the area
Home Values in the Area
Average Home Value in this Area
Purchase History
We collect this data history from publicly available records. To have your information removed, we recommend requesting removal directly through your county’s website.
| Date | Buyer | Sale Price | Title Company |
|---|---|---|---|
| Kurtzt Michael D | -- | None Available | |
| Michael D Kurtz Survivors Trust | -- | None Available | |
| Kurtz Michael D | -- | -- | |
| Kurtz Michael D | -- | United Title Company |
Source: Public Records
Mortgage History
We collect this data history from publicly available records. To have your information removed, we recommend requesting removal directly through your county’s website.
| Date | Status | Borrower | Loan Amount |
|---|---|---|---|
| Previous Owner | Kurtz Michael D | $300,000 | |
| Closed | Kurtz Michael D | $100,000 |
Source: Public Records
Tax History
| Year | Tax Paid | Tax Assessment Tax Assessment Total Assessment is a certain percentage of the fair market value that is determined by local assessors to be the total taxable value of land and additions on the property. | Land | Improvement |
|---|---|---|---|---|
| 2025 | $3,224 | $306,549 | $39,663 | $266,886 |
| 2024 | $3,224 | $300,539 | $38,886 | $261,653 |
| 2023 | $3,205 | $294,647 | $38,124 | $256,523 |
| 2022 | $3,155 | $288,871 | $37,377 | $251,494 |
| 2021 | $3,131 | $283,208 | $36,645 | $246,563 |
| 2020 | $3,109 | $280,305 | $36,270 | $244,035 |
| 2019 | $3,053 | $274,809 | $35,559 | $239,250 |
| 2018 | $2,926 | $269,421 | $34,862 | $234,559 |
| 2017 | $2,877 | $264,139 | $34,179 | $229,960 |
| 2016 | $2,761 | $258,960 | $33,509 | $225,451 |
| 2015 | $2,750 | $255,071 | $33,006 | $222,065 |
| 2014 | $2,704 | $250,076 | $32,360 | $217,716 |
Source: Public Records
Map
Nearby Homes
- 3354 Seacrest Dr
- 3170 Falcon Dr
- 3412 Celinda Dr
- 3515 Bedford Cir
- 2032 Avenue of The Trees
- 2038 Avenue of The Trees
- 2829 Forest View Way
- 2515 Via Esparto
- 2380 Hosp Way Unit 137
- 2382 Hosp Way Unit 143
- 2203 Cameo Rd
- 3201 Via Pescado
- 2360 Hosp Way Unit 331
- 2360 Hosp Way
- 2330 Hosp Way Unit 304
- 2794 Woodwind Rd
- 3736 Donna Ct
- 1665 Sandalwood Ln
- 2336 Hosp Way Unit 314
- 2275 Cameo Rd
- 3364 Seacrest Dr
- 3344 Seacrest Dr
- 3365 Ridgecrest Dr
- 3375 Ridgecrest Dr
- 3355 Ridgecrest Dr
- 3355 Seacrest Dr
- 3400 Seacrest Dr
- 3334 Seacrest Dr
- 3375 Seacrest Dr
- 3425 Ridgecrest Dr
- 3345 Ridgecrest Dr
- 3345 Seacrest Dr
- 3425 Seacrest Dr
- 3424 Seacrest Dr
- 3366 Ridgecrest Dr
- 3308 Donna Dr
- 3324 Seacrest Dr
- 3310 Donna Dr
- 3424 Ridgecrest Dr
- 3304 Donna Dr
Your Personal Tour Guide
Ask me questions while you tour the home.