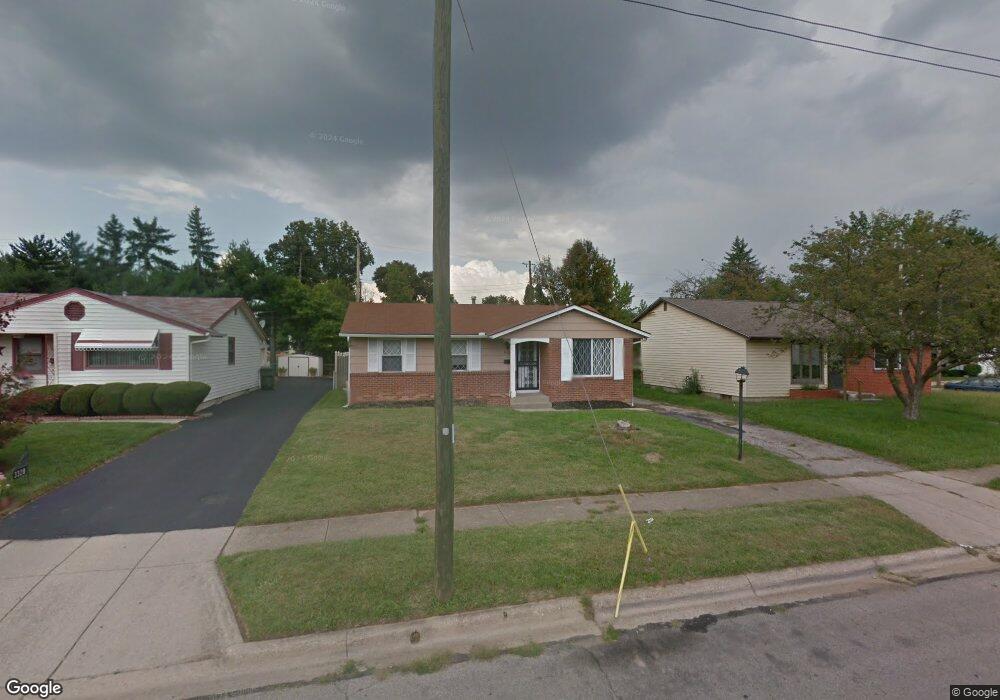
3336 Penfield Rd Columbus, OH 43227
Linwood NeighborhoodEstimated Value: $164,191 - $232,000
3
Beds
1
Bath
1,004
Sq Ft
$190/Sq Ft
Est. Value
About This Home
This home is located at 3336 Penfield Rd, Columbus, OH 43227 and is currently estimated at $190,798, approximately $190 per square foot. 3336 Penfield Rd is a home located in Franklin County with nearby schools including Scottwood Elementary School, Johnson Park Middle School, and Walnut Ridge High School.
Ownership History
Date
Name
Owned For
Owner Type
Purchase Details
Closed on
Jan 11, 2012
Sold by
Ouhammou Brahim
Bought by
Noor Investments Llc
Current Estimated Value
Purchase Details
Closed on
Oct 28, 2011
Sold by
Royal Charmelle L and Royal Charmelle
Bought by
Ouhammou Brahim
Purchase Details
Closed on
Jul 13, 1995
Sold by
Lelux Enterprises
Bought by
Charmelle Royal
Home Financials for this Owner
Home Financials are based on the most recent Mortgage that was taken out on this home.
Original Mortgage
$59,050
Interest Rate
7.79%
Mortgage Type
New Conventional
Purchase Details
Closed on
May 23, 1995
Sold by
Shrf Anita L Philmore Pr
Bought by
Lelux Enterprise
Home Financials for this Owner
Home Financials are based on the most recent Mortgage that was taken out on this home.
Original Mortgage
$59,050
Interest Rate
7.79%
Mortgage Type
New Conventional
Purchase Details
Closed on
Nov 27, 1987
Create a Home Valuation Report for This Property
The Home Valuation Report is an in-depth analysis detailing your home's value as well as a comparison with similar homes in the area
Home Values in the Area
Average Home Value in this Area
Purchase History
| Date | Buyer | Sale Price | Title Company |
|---|---|---|---|
| Noor Investments Llc | -- | Attorney | |
| Ouhammou Brahim | $26,500 | Attorney | |
| Charmelle Royal | $61,000 | -- | |
| Lelux Enterprise | $42,400 | -- | |
| -- | -- | -- |
Source: Public Records
Mortgage History
| Date | Status | Borrower | Loan Amount |
|---|---|---|---|
| Previous Owner | Charmelle Royal | $59,050 |
Source: Public Records
Tax History
| Year | Tax Paid | Tax Assessment Tax Assessment Total Assessment is a certain percentage of the fair market value that is determined by local assessors to be the total taxable value of land and additions on the property. | Land | Improvement |
|---|---|---|---|---|
| 2025 | $2,308 | $47,080 | $11,730 | $35,350 |
| 2024 | $2,308 | $47,080 | $11,730 | $35,350 |
| 2023 | $2,281 | $47,075 | $11,725 | $35,350 |
| 2022 | $1,562 | $26,570 | $6,480 | $20,090 |
| 2021 | $2,128 | $26,570 | $6,480 | $20,090 |
| 2020 | $1,742 | $26,570 | $6,480 | $20,090 |
| 2019 | $1,512 | $21,910 | $5,390 | $16,520 |
| 2018 | $1,191 | $21,910 | $5,390 | $16,520 |
| 2017 | $1,412 | $21,910 | $5,390 | $16,520 |
| 2016 | $954 | $13,300 | $4,200 | $9,100 |
| 2015 | $873 | $13,300 | $4,200 | $9,100 |
| 2014 | $1,014 | $16,350 | $4,200 | $12,150 |
| 2013 | $555 | $18,130 | $4,655 | $13,475 |
Source: Public Records
Map
Nearby Homes
- 1884 Barnett Ct W
- 3325 E Deshler Ave
- 3428 LIV Moor Dr
- 3285 Scottwood Rd
- 1679 Penfield Rd
- 3038 Wadsworth Ct
- 3036 Wadsworth Ct
- 2251 Meridian Ct
- 1637 S James Rd
- 0 Rotunda Dr Unit 271
- 2275 Cardston Ct
- 2942 Arrowhead Ct
- 1619 Basil Dr
- 2278 Wadsworth Dr Unit D
- 1353 Barnett Rd
- 2840 Manola Dr
- 2813 Kingsrowe Ct Unit 43
- 1677 Kenview Rd
- 3622 Cushing Dr Unit C
- 1455 Wilmore Dr
- 3328 Penfield Rd
- 3342 Penfield Rd
- 1847 Binbrook Rd
- 3322 Penfield Rd
- 1839 Binbrook Rd
- 3314 Penfield Rd
- 1870 Defford Ct
- 1877 Binbrook Ct
- 1835 Binbrook Rd
- 1858 Binbrook Rd
- 3308 Penfield Rd
- 1850 Binbrook Rd
- 1876 Defford Ct
- 1885 Binbrook Ct
- 1844 Binbrook Rd
- 1827 Binbrook Rd
- 3366 Penfield Rd
- 1836 Binbrook Rd
- 3302 Penfield Rd
- 1882 Defford Ct
Your Personal Tour Guide
Ask me questions while you tour the home.