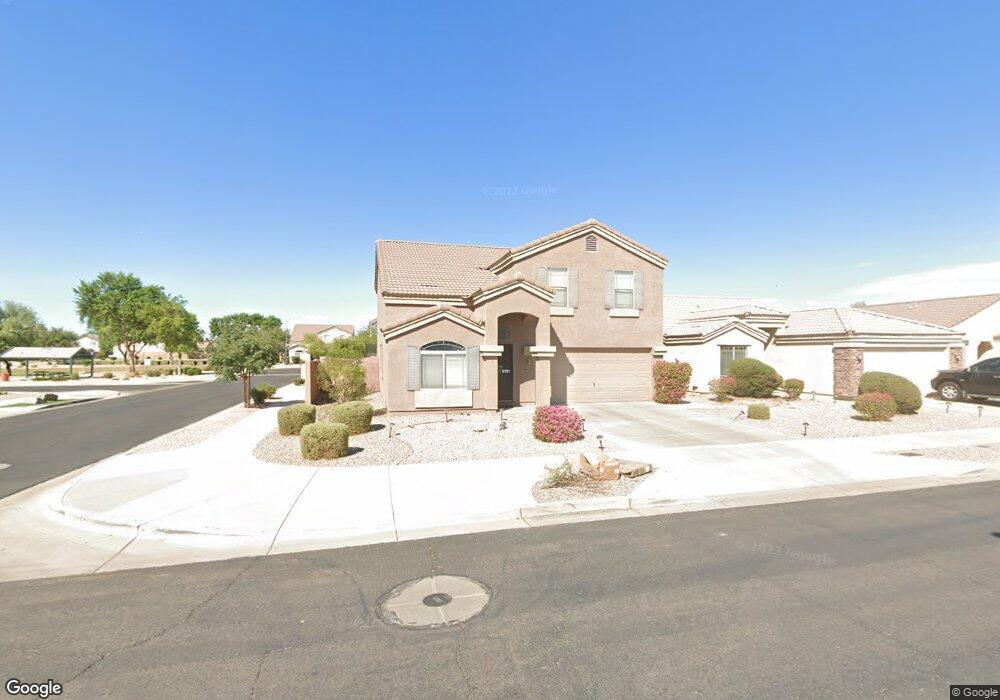
3336 W Wayland Dr Phoenix, AZ 85041
Laveen NeighborhoodEstimated Value: $351,303 - $437,000
--
Bed
3
Baths
2,165
Sq Ft
$186/Sq Ft
Est. Value
About This Home
This home is located at 3336 W Wayland Dr, Phoenix, AZ 85041 and is currently estimated at $402,576, approximately $185 per square foot. 3336 W Wayland Dr is a home located in Maricopa County with nearby schools including Bernard Black Elementary School, Cesar Chavez High School, and Phoenix Coding Academy.
Ownership History
Date
Name
Owned For
Owner Type
Purchase Details
Closed on
Apr 18, 2018
Sold by
Sby 2014 1 Borrower Llc
Bought by
Tah 2018 1 Borrower Llc
Current Estimated Value
Purchase Details
Closed on
Aug 12, 2014
Sold by
Resi Ii Llc
Bought by
Sby 2014 1 Borrower Llc
Purchase Details
Closed on
Nov 21, 2011
Sold by
Metropolitan West Valley Llc
Bought by
Resi Ii Llc
Purchase Details
Closed on
Nov 7, 2011
Sold by
Rashid Abdu
Bought by
Metropolitan West Valley Llc
Purchase Details
Closed on
Oct 3, 2007
Sold by
Rashid Abdur
Bought by
Rashid Abdur and Rashid Reba
Purchase Details
Closed on
Aug 2, 2005
Sold by
Rashid Reba
Bought by
Rashid Abdur
Home Financials for this Owner
Home Financials are based on the most recent Mortgage that was taken out on this home.
Original Mortgage
$175,344
Interest Rate
6.25%
Mortgage Type
Purchase Money Mortgage
Create a Home Valuation Report for This Property
The Home Valuation Report is an in-depth analysis detailing your home's value as well as a comparison with similar homes in the area
Home Values in the Area
Average Home Value in this Area
Purchase History
| Date | Buyer | Sale Price | Title Company |
|---|---|---|---|
| Tah 2018 1 Borrower Llc | -- | Os National Llc | |
| Sby 2014 1 Borrower Llc | -- | None Available | |
| Resi Ii Llc | -- | Accommodation | |
| Metropolitan West Valley Llc | $82,100 | Accommodation | |
| Rashid Abdur | -- | None Available | |
| Rashid Abdur | -- | Dhi Title Of Arizona Inc | |
| Rashid Abdur | $233,793 | Dhi Title Of Arizona Inc |
Source: Public Records
Mortgage History
| Date | Status | Borrower | Loan Amount |
|---|---|---|---|
| Previous Owner | Rashid Abdur | $175,344 |
Source: Public Records
Tax History Compared to Growth
Tax History
| Year | Tax Paid | Tax Assessment Tax Assessment Total Assessment is a certain percentage of the fair market value that is determined by local assessors to be the total taxable value of land and additions on the property. | Land | Improvement |
|---|---|---|---|---|
| 2025 | $2,009 | $13,678 | -- | -- |
| 2024 | $1,952 | $13,026 | -- | -- |
| 2023 | $1,952 | $28,430 | $5,680 | $22,750 |
| 2022 | $1,913 | $21,300 | $4,260 | $17,040 |
| 2021 | $1,952 | $19,910 | $3,980 | $15,930 |
| 2020 | $1,928 | $17,830 | $3,560 | $14,270 |
| 2019 | $1,865 | $15,900 | $3,180 | $12,720 |
| 2018 | $1,815 | $15,580 | $3,110 | $12,470 |
| 2017 | $1,730 | $13,700 | $2,740 | $10,960 |
| 2016 | $1,645 | $12,480 | $2,490 | $9,990 |
| 2015 | $1,549 | $10,730 | $2,140 | $8,590 |
Source: Public Records
Map
Nearby Homes
- 3313 W Wayland Dr
- 3338 W Sunland Ave
- 3228 W Wayland Dr
- 3433 W Chambers St
- 3434 W Chambers St
- 3233 W Pleasant Ln
- 3622 W Sunland Ave
- 3410 W T Ryan Ln
- 3042 W Fraktur Rd
- 3327 W Leodra Ln
- 5012 S 35th Dr
- 3232 W Saint Anne Ave
- 3201 W Saint Catherine Ave
- 3443 W Saint Anne Ave
- 3412 W Apollo Rd
- 3747 W Atlanta Ave
- 2909 W Bowker St
- 2826 W La Salle St
- 3731 W Wier Ave
- 2754 W Pecan Rd
- 3332 W Wayland Dr
- 3332 W Wayland Dr Unit 1
- 3328 W Wayland Dr
- 3335 W Fraktur Rd
- 3331 W Fraktur Rd
- 3324 W Wayland Dr
- 5710 S 33rd Dr
- 3327 W Fraktur Rd Unit 1
- 3337 W Wayland Dr
- 5714 S 33rd Dr
- 3333 W Wayland Dr Unit 1
- 3320 W Wayland Dr
- 3329 W Wayland Dr
- 5718 S 33rd Dr
- 3325 W Wayland Dr
- 3319 W Fraktur Rd
- 3316 W Wayland Dr
- 5722 S 33rd Dr
- 5705 S 34th Ave Unit 1
- 3321 W Wayland Dr