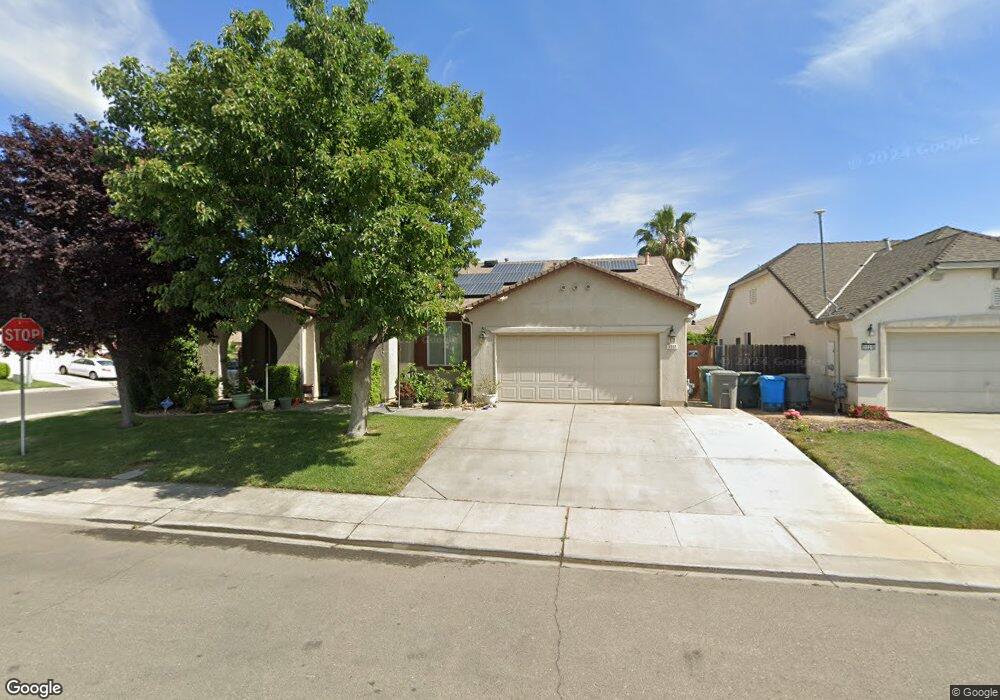
3337 Baker Way Live Oak, CA 95953
Estimated Value: $292,000 - $469,000
3
Beds
2
Baths
2,073
Sq Ft
$197/Sq Ft
Est. Value
About This Home
This home is located at 3337 Baker Way, Live Oak, CA 95953 and is currently estimated at $408,164, approximately $196 per square foot. 3337 Baker Way is a home located in Sutter County.
Ownership History
Date
Name
Owned For
Owner Type
Purchase Details
Closed on
Mar 8, 2024
Sold by
Silveira Marsha L and Silveira Lester S
Bought by
Silveira Marsha L
Current Estimated Value
Purchase Details
Closed on
Jan 15, 2009
Sold by
Us Bank National Association
Bought by
Silveira Marsha L and Silveira Lester S
Home Financials for this Owner
Home Financials are based on the most recent Mortgage that was taken out on this home.
Original Mortgage
$184,891
Interest Rate
5.01%
Mortgage Type
VA
Purchase Details
Closed on
Nov 25, 2008
Sold by
Hughes Glenda A
Bought by
Us Bank National Association
Home Financials for this Owner
Home Financials are based on the most recent Mortgage that was taken out on this home.
Original Mortgage
$184,891
Interest Rate
5.01%
Mortgage Type
VA
Purchase Details
Closed on
Jul 12, 2005
Sold by
Kb Home North Bay Inc
Bought by
Hughes Glenda A
Home Financials for this Owner
Home Financials are based on the most recent Mortgage that was taken out on this home.
Original Mortgage
$70,490
Interest Rate
5.56%
Mortgage Type
Stand Alone Second
Create a Home Valuation Report for This Property
The Home Valuation Report is an in-depth analysis detailing your home's value as well as a comparison with similar homes in the area
Purchase History
| Date | Buyer | Sale Price | Title Company |
|---|---|---|---|
| Silveira Marsha L | -- | None Listed On Document | |
| Silveira Marsha L | $181,000 | Lsi Title Agency | |
| Us Bank National Association | $283,034 | Accommodation | |
| Hughes Glenda A | $352,500 | First American Title Co |
Source: Public Records
Mortgage History
| Date | Status | Borrower | Loan Amount |
|---|---|---|---|
| Previous Owner | Silveira Marsha L | $184,891 | |
| Previous Owner | Hughes Glenda A | $70,490 | |
| Previous Owner | Hughes Glenda A | $281,962 |
Source: Public Records
Tax History
| Year | Tax Paid | Tax Assessment Tax Assessment Total Assessment is a certain percentage of the fair market value that is determined by local assessors to be the total taxable value of land and additions on the property. | Land | Improvement |
|---|---|---|---|---|
| 2025 | $3,530 | $233,063 | $57,939 | $175,124 |
| 2024 | $3,530 | $228,494 | $56,803 | $171,691 |
| 2023 | $3,530 | $224,015 | $55,690 | $168,325 |
| 2022 | $3,445 | $219,624 | $54,599 | $165,025 |
| 2021 | $2,510 | $215,336 | $53,537 | $161,799 |
| 2020 | $3,402 | $213,128 | $52,988 | $160,140 |
| 2019 | $3,330 | $208,948 | $51,948 | $157,000 |
| 2018 | $3,297 | $204,851 | $50,930 | $153,921 |
| 2017 | $3,277 | $200,834 | $49,931 | $150,903 |
| 2016 | $3,102 | $196,896 | $48,952 | $147,944 |
Source: Public Records
Map
Nearby Homes
- 3171 Cole Ct
- 10118 Luther Rd
- 3158 Lilac Ct
- 10089 Rose Ave
- 3182 Heather Dr
- 9410 Rose Ct
- 9814 N St
- 2611 Fir St
- 2624 Elm St
- 14499 N Butte Rd
- 2682 Pear St
- 0 Ivy St
- 9375 Live Oak Blvd
- 10237 Live Oak Blvd
- 2537 Ivy St
- 2421 Archer Ave
- 10375 Live Oak Blvd
- 10383 Larkin Rd Unit 43
- 2294 Anita St
- 10726 Irene Way
- 3325 Baker Way
- 3338 Arbor Way
- 3326 Arbor Way
- 3313 Baker Way
- 9888 Ellis Way
- 9876 Ellis Way
- 3338 Baker Way
- 3314 Arbor Way
- 9900 Ellis Way
- 9864 Ellis Way
- 3326 Baker Way
- 3301 Baker Way
- 3314 Baker Way
- 9852 Ellis Way
- 9912 Ellis Way
- 3302 Arbor Way
- 3302 Baker Way
- 9840 Ellis Way
- 9875 Richmond Way
- 9887 Richmond Way