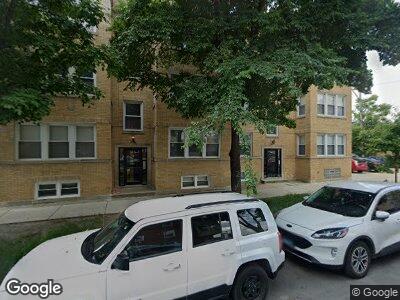
3337 W Byron St Unit 33373 Chicago, IL 60618
Irving Park NeighborhoodEstimated Value: $261,000 - $322,000
2
Beds
1
Bath
10,416
Sq Ft
$27/Sq Ft
Est. Value
About This Home
This home is located at 3337 W Byron St Unit 33373, Chicago, IL 60618 and is currently estimated at $279,812, approximately $26 per square foot. 3337 W Byron St Unit 33373 is a home located in Cook County with nearby schools including Cleveland Elementary School, Schurz High School, and CICS Irving Park.
Ownership History
Date
Name
Owned For
Owner Type
Purchase Details
Closed on
Aug 24, 2021
Sold by
Benson Kimberly
Bought by
Susenburger Nicole
Current Estimated Value
Home Financials for this Owner
Home Financials are based on the most recent Mortgage that was taken out on this home.
Original Mortgage
$192,720
Outstanding Balance
$177,261
Interest Rate
2.8%
Mortgage Type
New Conventional
Estimated Equity
$76,668
Purchase Details
Closed on
Jul 20, 2015
Sold by
Juaniza Marta B
Bought by
Benson Kimberly
Home Financials for this Owner
Home Financials are based on the most recent Mortgage that was taken out on this home.
Original Mortgage
$132,930
Interest Rate
4%
Mortgage Type
New Conventional
Purchase Details
Closed on
Feb 19, 2008
Sold by
3335 W Byron Inc
Bought by
Juaniza Marta B
Home Financials for this Owner
Home Financials are based on the most recent Mortgage that was taken out on this home.
Original Mortgage
$205,200
Interest Rate
5.75%
Mortgage Type
Unknown
Create a Home Valuation Report for This Property
The Home Valuation Report is an in-depth analysis detailing your home's value as well as a comparison with similar homes in the area
Home Values in the Area
Average Home Value in this Area
Purchase History
| Date | Buyer | Sale Price | Title Company |
|---|---|---|---|
| Susenburger Nicole | $219,000 | Alliance Title Company | |
| Benson Kimberly | $190,000 | Attorney | |
| Juaniza Marta B | $216,000 | None Available |
Source: Public Records
Mortgage History
| Date | Status | Borrower | Loan Amount |
|---|---|---|---|
| Open | Susenburger Nicole | $192,720 | |
| Previous Owner | Benson Kimberly | $132,930 | |
| Previous Owner | Juaniza Marta B | $190,000 | |
| Previous Owner | Juaniza Marta B | $205,200 |
Source: Public Records
Tax History Compared to Growth
Tax History
| Year | Tax Paid | Tax Assessment Tax Assessment Total Assessment is a certain percentage of the fair market value that is determined by local assessors to be the total taxable value of land and additions on the property. | Land | Improvement |
|---|---|---|---|---|
| 2024 | $4,338 | $23,557 | $2,620 | $20,937 |
| 2023 | $4,338 | $21,017 | $2,108 | $18,909 |
| 2022 | $4,338 | $21,017 | $2,108 | $18,909 |
| 2021 | $4,170 | $23,999 | $2,108 | $21,891 |
| 2020 | $3,200 | $17,418 | $963 | $16,455 |
| 2019 | $3,238 | $19,493 | $963 | $18,530 |
| 2018 | $3,182 | $19,493 | $963 | $18,530 |
| 2017 | $3,805 | $20,994 | $843 | $20,151 |
| 2016 | $3,717 | $20,994 | $843 | $20,151 |
| 2015 | $3,378 | $20,994 | $843 | $20,151 |
| 2014 | $2,578 | $16,412 | $722 | $15,690 |
| 2013 | $2,516 | $16,412 | $722 | $15,690 |
Source: Public Records
Map
Nearby Homes
- 3818 N Christiana Ave
- 3809 N Kimball Ave
- 3850 N Bernard St
- 3755 N Kimball Ave
- 3300 W Irving Park Rd Unit F4
- 3935 N Saint Louis Ave
- 3754 N Bernard St Unit 1-C
- 4014 N Kimball Ave
- 3709 N Elston Ave Unit 2
- 4026 N Kimball Ave
- 3446 W Irving Park Rd
- 3903 N Drake Ave
- 3311 W Belle Plaine Ave
- 4038 N Bernard St
- 3675 N Elston Ave
- 3938 N Troy St
- 3707 N Saint Louis Ave
- 4109 N Kimball Ave
- 3223 W Belle Plaine Ave
- 3637 N Spaulding Ave Unit 205
- 3337 W Byron St Unit 2
- 3337 W Byron St Unit 33372
- 3337 W Byron St Unit 33371
- 3337 W Byron St Unit 33373
- 3337 W Byron St Unit 3337G
- 3337 W Byron St Unit 3
- 3337 W Byron St Unit 1
- 3337 W Byron St
- 3337 W Byron St Unit G
- 3335 W Byron St Unit 3335G
- 3335 W Byron St Unit 33353
- 3335 W Byron St Unit 33352
- 3335 W Byron St Unit 33351
- 3335 W Byron St Unit G
- 3335 W Byron St Unit 1
- 3335 W Byron St Unit 2
- 3335 W Byron St Unit 3
- 3339 W Byron St Unit 3
- 3339 W Byron St Unit P5
- 3339 W Byron St Unit P6