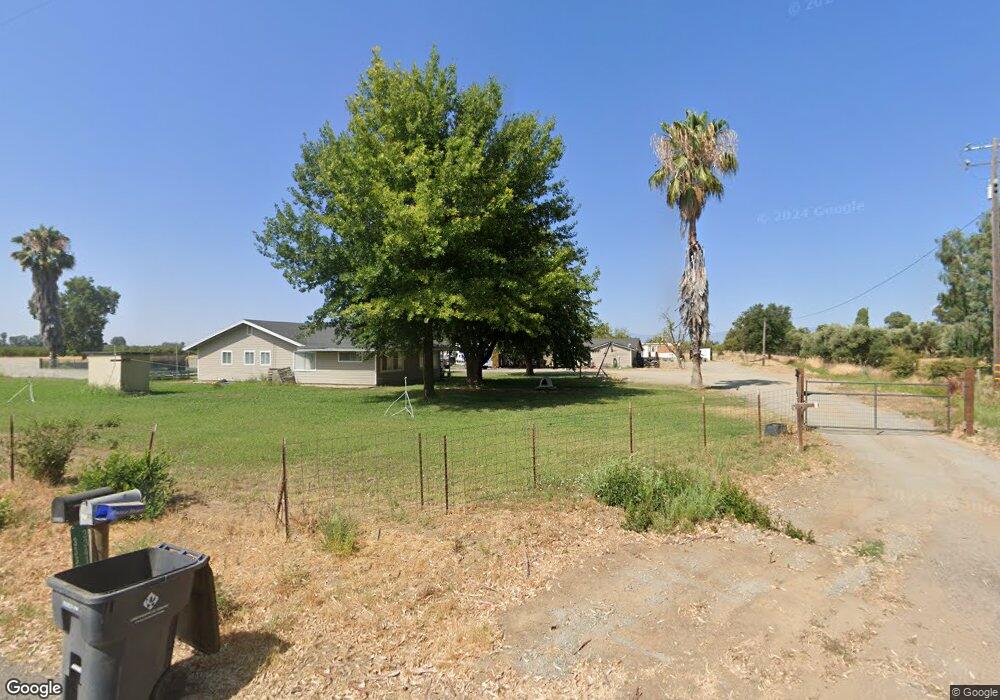
3339 Woodson Ave Corning, CA 96021
Estimated Value: $481,007 - $557,000
3
Beds
3
Baths
2,696
Sq Ft
$193/Sq Ft
Est. Value
About This Home
This home is located at 3339 Woodson Ave, Corning, CA 96021 and is currently estimated at $519,252, approximately $192 per square foot. 3339 Woodson Ave is a home located in Tehama County with nearby schools including Olive View Elementary School, Maywood Middle School, and Corning High School.
Ownership History
Date
Name
Owned For
Owner Type
Purchase Details
Closed on
Jun 19, 2007
Sold by
Gregorio Frank
Bought by
Gregorio Frank and Gregorio Elizabeth
Current Estimated Value
Home Financials for this Owner
Home Financials are based on the most recent Mortgage that was taken out on this home.
Original Mortgage
$150,000
Outstanding Balance
$91,635
Interest Rate
6.16%
Mortgage Type
Credit Line Revolving
Estimated Equity
$427,617
Purchase Details
Closed on
Jun 15, 2007
Sold by
Gregorio Frank S and Gregorio Elizabeth
Bought by
Gregorio Frank
Home Financials for this Owner
Home Financials are based on the most recent Mortgage that was taken out on this home.
Original Mortgage
$150,000
Outstanding Balance
$91,635
Interest Rate
6.16%
Mortgage Type
Credit Line Revolving
Estimated Equity
$427,617
Purchase Details
Closed on
Dec 23, 2002
Sold by
Citifinancial Mortgage Co Inc
Bought by
Gregorio Frank S and Gregorio Elizabeth R
Home Financials for this Owner
Home Financials are based on the most recent Mortgage that was taken out on this home.
Original Mortgage
$146,300
Interest Rate
5.96%
Purchase Details
Closed on
Aug 2, 2002
Sold by
Gilbert Cuthbert
Bought by
Citifinancial Mtg Company
Create a Home Valuation Report for This Property
The Home Valuation Report is an in-depth analysis detailing your home's value as well as a comparison with similar homes in the area
Purchase History
| Date | Buyer | Sale Price | Title Company |
|---|---|---|---|
| Gregorio Frank | -- | None Available | |
| Gregorio Frank | -- | Placer Title Company | |
| Gregorio Frank S | $154,500 | Chicago Title Co | |
| Citifinancial Mtg Company | $115,000 | Northern California Title Co |
Source: Public Records
Mortgage History
| Date | Status | Borrower | Loan Amount |
|---|---|---|---|
| Open | Gregorio Frank | $150,000 | |
| Closed | Gregorio Frank S | $146,300 |
Source: Public Records
Tax History
| Year | Tax Paid | Tax Assessment Tax Assessment Total Assessment is a certain percentage of the fair market value that is determined by local assessors to be the total taxable value of land and additions on the property. | Land | Improvement |
|---|---|---|---|---|
| 2025 | $3,046 | $291,978 | $79,646 | $212,332 |
| 2023 | $2,990 | $280,642 | $76,554 | $204,088 |
| 2022 | $2,948 | $275,140 | $75,053 | $200,087 |
| 2021 | $2,828 | $269,746 | $73,582 | $196,164 |
| 2020 | $2,871 | $266,981 | $72,828 | $194,153 |
| 2019 | $2,815 | $261,747 | $71,400 | $190,347 |
| 2018 | $2,819 | $256,615 | $70,000 | $186,615 |
| 2017 | $2,801 | $251,584 | $68,628 | $182,956 |
| 2016 | $2,617 | $246,652 | $67,283 | $179,369 |
| 2015 | -- | $242,948 | $66,273 | $176,675 |
| 2014 | $2,559 | $238,190 | $64,975 | $173,215 |
Source: Public Records
Map
Nearby Homes
- 3646 Kirkwood Rd
- 2946 Kirkwood Rd
- 3781 Columbia Ave
- 2915 S 99w
- 2790 Foster Ave
- 3911 Columbia Ave
- 22519 Olivewood Rd
- 00 Loleta Ave
- 4019 Marguerite Ave
- 0 Houghton Ave Unit 324045531
- 0 Hwy 99 W Unit SN26028885
- 0 Loleta Ave Unit SN25184964
- 1568 Link St
- 1311 6th Ave
- 0 Toomes Ave Unit SN25272183
- 0 Toomes Ave Unit SN24222817
- 0 Toomes Ave Unit SN25176211
- 23580 Loleta Ave
- 1308 Pear St
- 2067 Blossom Ave
- 0 Woodson Ave Unit SN18235364
- 0 Woodson Ave Unit 11000049
- 0 Woodson Ave Unit SN19168180
- 0 Woodson Ave Unit SN19150783
- 0 Woodson Ave Unit 20190791
- 3340 Woodson Ave
- 3369 Woodson Ave
- 3296 Woodson Ave
- 3338 Houghton Ave
- 3400 Woodson Ave
- 3435 Woodson Ave
- 3280 Woodson Ave
- 3426 Kirkwood Rd
- 3430 Houghton Ave
- 3420 Houghton Ave
- 3211 Woodson Ave
- 3325 Houghton Ave
- 3210 Woodson Ave
- 3495 Kirkwood Rd
- 3352 Kirkwood Rd
Your Personal Tour Guide
Ask me questions while you tour the home.