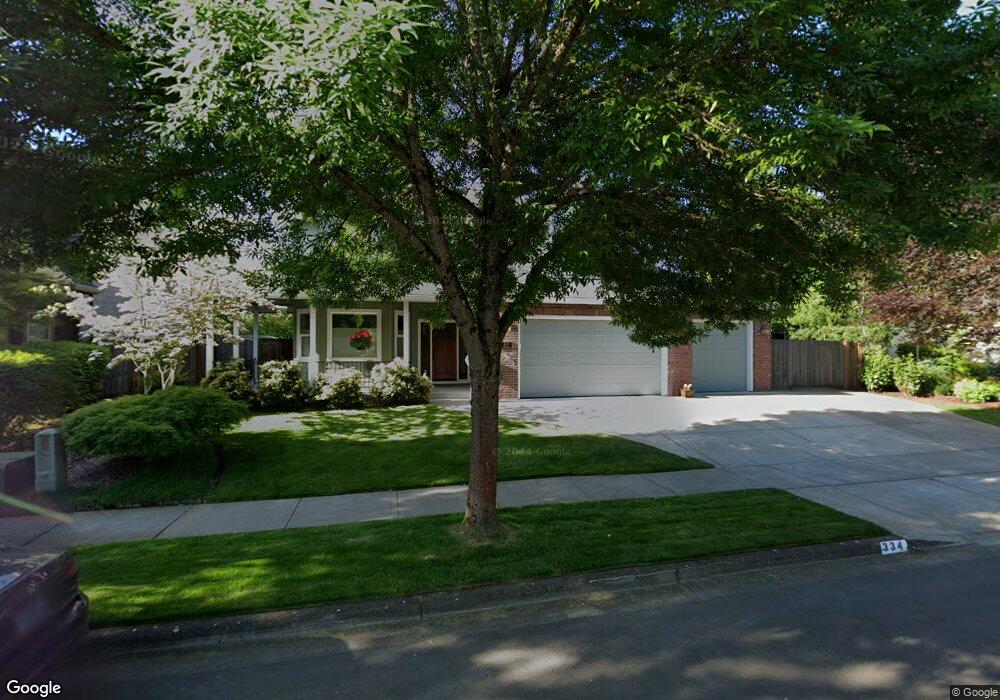
334 Lazy Ave Eugene, OR 97404
Santa Clara NeighborhoodEstimated Value: $634,293 - $723,000
3
Beds
3
Baths
2,002
Sq Ft
$331/Sq Ft
Est. Value
About This Home
This home is located at 334 Lazy Ave, Eugene, OR 97404 and is currently estimated at $661,823, approximately $330 per square foot. 334 Lazy Ave is a home located in Lane County with nearby schools including Awbrey Park Elementary School, Madison Middle School, and North Eugene High School.
Ownership History
Date
Name
Owned For
Owner Type
Purchase Details
Closed on
Sep 20, 2016
Sold by
Fry Tony A and Fry Nancy F
Bought by
Hull Thomas and Zuber Michaela
Current Estimated Value
Purchase Details
Closed on
Sep 29, 2006
Sold by
Regal Custom Homes Inc
Bought by
Fry Tony A and Fry Nancy F
Home Financials for this Owner
Home Financials are based on the most recent Mortgage that was taken out on this home.
Original Mortgage
$280,100
Interest Rate
6.53%
Mortgage Type
Purchase Money Mortgage
Purchase Details
Closed on
Mar 15, 2006
Sold by
Kids Enterprises Llc
Bought by
Regal Custom Homes Inc
Home Financials for this Owner
Home Financials are based on the most recent Mortgage that was taken out on this home.
Original Mortgage
$86,250
Interest Rate
6.19%
Mortgage Type
Credit Line Revolving
Create a Home Valuation Report for This Property
The Home Valuation Report is an in-depth analysis detailing your home's value as well as a comparison with similar homes in the area
Home Values in the Area
Average Home Value in this Area
Purchase History
| Date | Buyer | Sale Price | Title Company |
|---|---|---|---|
| Hull Thomas | $415,000 | Cascade Title Company | |
| Fry Tony A | $425,341 | Fidelity National Title Insu | |
| Regal Custom Homes Inc | $115,000 | Pacific Northwest Title Of L |
Source: Public Records
Mortgage History
| Date | Status | Borrower | Loan Amount |
|---|---|---|---|
| Previous Owner | Fry Tony A | $280,100 | |
| Previous Owner | Regal Custom Homes Inc | $86,250 |
Source: Public Records
Tax History
| Year | Tax Paid | Tax Assessment Tax Assessment Total Assessment is a certain percentage of the fair market value that is determined by local assessors to be the total taxable value of land and additions on the property. | Land | Improvement |
|---|---|---|---|---|
| 2025 | $8,117 | $416,605 | -- | -- |
| 2024 | $8,016 | $404,471 | -- | -- |
| 2023 | $8,016 | $392,691 | $0 | $0 |
| 2022 | $7,510 | $381,254 | $0 | $0 |
| 2021 | $7,053 | $370,150 | $0 | $0 |
| 2020 | $7,021 | $359,369 | $0 | $0 |
| 2019 | $6,736 | $348,902 | $0 | $0 |
| 2018 | $6,226 | $328,874 | $0 | $0 |
| 2017 | $5,893 | $328,874 | $0 | $0 |
| 2016 | $5,766 | $319,295 | $0 | $0 |
| 2015 | $5,539 | $309,995 | $0 | $0 |
| 2014 | $5,319 | $300,966 | $0 | $0 |
Source: Public Records
Map
Nearby Homes
- 0 450-1 Unit 582743661
- 190 River Loop 1
- 450 Hunsaker Ln
- 0 450-2 Unit 657824339
- 190 Hunsaker Ln
- 2640 Green Villa Ln
- 346 River Loop 1
- 425 Autumn Ave
- 84 Green Ln
- 51 Grizzly Ave
- 3346 Zane Ln
- 3352 Zane Ln
- 215 Jonquil Ave
- 193 Santa Clara Ave
- 501 Division Ave Unit 28
- 501 Division Ave Unit 11
- 2439 Quince St
- 349 Irving Rd
- 2612 Sage St
- 504 Dean Ave
Your Personal Tour Guide
Ask me questions while you tour the home.