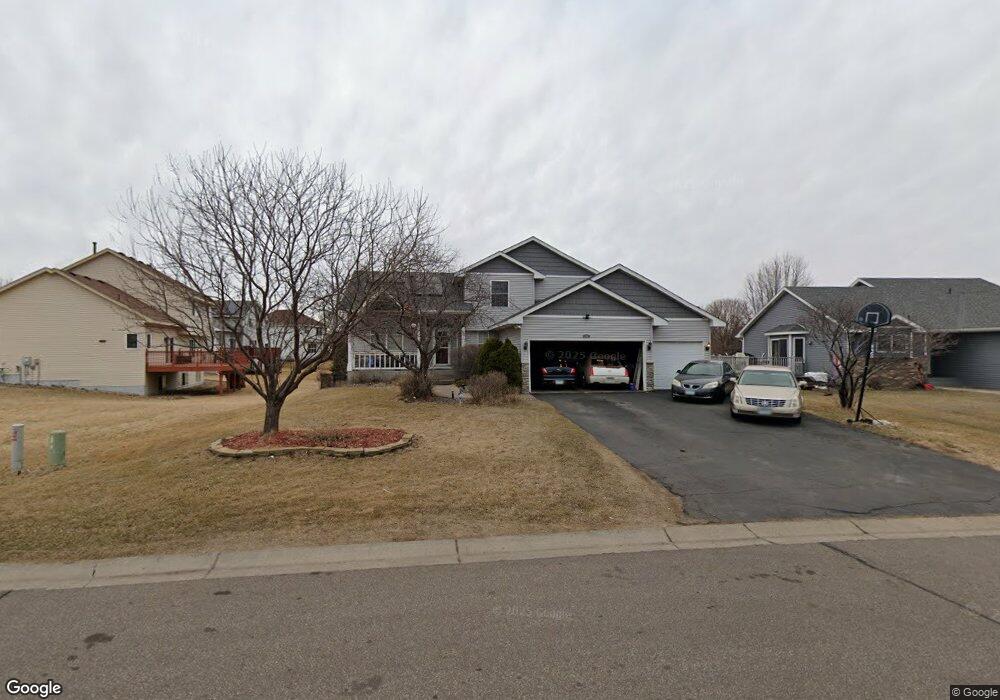
3340 Carnation Ave N Brooklyn Park, MN 55443
Pinebrook Village NeighborhoodEstimated Value: $492,612 - $533,000
4
Beds
4
Baths
2,116
Sq Ft
$245/Sq Ft
Est. Value
About This Home
This home is located at 3340 Carnation Ave N, Brooklyn Park, MN 55443 and is currently estimated at $518,903, approximately $245 per square foot. 3340 Carnation Ave N is a home located in Hennepin County with nearby schools including Woodland Elementary School, Park Center Senior High, and St. Vincent de Paul Catholic School.
Ownership History
Date
Name
Owned For
Owner Type
Purchase Details
Closed on
Apr 27, 2016
Sold by
Gregerson Matthew R and Gregerson Nadine M
Bought by
Granison Darrick and Granison Brenda J
Current Estimated Value
Home Financials for this Owner
Home Financials are based on the most recent Mortgage that was taken out on this home.
Original Mortgage
$366,611
Outstanding Balance
$292,512
Interest Rate
3.73%
Mortgage Type
VA
Estimated Equity
$226,391
Purchase Details
Closed on
May 26, 2006
Sold by
Douglas Justin W and Douglas Dana E
Bought by
Gregerson Matthew R and Gregerson Nadine M
Purchase Details
Closed on
Jan 15, 2004
Sold by
Johnson Chad A and Johnson Dayna M
Bought by
Douglas Justin William and Douglas Dana Elizabeth
Purchase Details
Closed on
Oct 30, 2000
Sold by
Key-Land Homes
Bought by
Johnson Chad A and Johnson Dayna M
Purchase Details
Closed on
Jun 9, 2000
Sold by
Astra Genstar Partnership L L P
Bought by
Key-Land Homes
Create a Home Valuation Report for This Property
The Home Valuation Report is an in-depth analysis detailing your home's value as well as a comparison with similar homes in the area
Home Values in the Area
Average Home Value in this Area
Purchase History
| Date | Buyer | Sale Price | Title Company |
|---|---|---|---|
| Granison Darrick | $354,900 | First American Title Ins Co | |
| Gregerson Matthew R | $349,000 | -- | |
| Douglas Justin William | $300,000 | -- | |
| Johnson Chad A | $225,000 | -- | |
| Key-Land Homes | $43,900 | -- |
Source: Public Records
Mortgage History
| Date | Status | Borrower | Loan Amount |
|---|---|---|---|
| Open | Granison Darrick | $366,611 |
Source: Public Records
Tax History Compared to Growth
Tax History
| Year | Tax Paid | Tax Assessment Tax Assessment Total Assessment is a certain percentage of the fair market value that is determined by local assessors to be the total taxable value of land and additions on the property. | Land | Improvement |
|---|---|---|---|---|
| 2024 | $7,606 | $449,200 | $130,000 | $319,200 |
| 2023 | $6,176 | $446,700 | $130,000 | $316,700 |
| 2022 | $6,942 | $457,600 | $130,000 | $327,600 |
| 2021 | $6,417 | $377,600 | $78,000 | $299,600 |
| 2020 | $6,597 | $374,900 | $78,000 | $296,900 |
| 2019 | $5,940 | $344,800 | $78,000 | $266,800 |
| 2018 | $5,704 | $320,500 | $70,300 | $250,200 |
| 2017 | $4,729 | $294,400 | $70,300 | $224,100 |
| 2016 | $4,466 | $275,800 | $70,300 | $205,500 |
| 2015 | $4,493 | $270,300 | $60,600 | $209,700 |
| 2014 | -- | $235,000 | $60,600 | $174,400 |
Source: Public Records
Map
Nearby Homes
- 3216 Carnation Ave N
- 9331 Austrian Pine Ave N
- 3809 Impatiens Ln N
- 3907 Foxglove Ct N
- 9325 Vincent Ave N
- 9743 Greenspruce Ct N
- 10020 Butternut Ave N
- 9136 Windsor Terrace
- 2623 93rd Way
- 9813 Linden Ave N
- 9955 Russell Ave N Unit 10
- 10005 Russell Ave N Unit 3
- 9025 Windsor Terrace
- 4224 93rd Ave N
- 4503 Ladyslipper Ave N
- 2801 91st Crescent N
- 8931 Ashley Terrace
- 4616 Marigold Ave N
- 9121 Loch Lomond Blvd
- 8909 Vickors Crossing
- 3332 Carnation Ave N
- 9522 Cherrywood Ave N
- 3343 Daylily Ave N
- 3335 Daylily Ave N
- 9600 Cherrywood Ave N
- 3324 Carnation Ave N
- 3327 Daylily Ave N
- 9606 Cherrywood Ave N
- 3316 Carnation Ave N
- 3342 Bluebell Ave N
- 3319 Daylily Ave N
- 3334 Bluebell Ave N
- 9507 Cherrywood Ave N
- 9601 Cherrywood Ave N
- 3308 Carnation Ave N
- 3344 Daylily Ave N
- 3311 Daylily Ave N
- 3352 Daylily Ave N
- 3336 Daylily Ave N
- 3309 Carnation Ave N