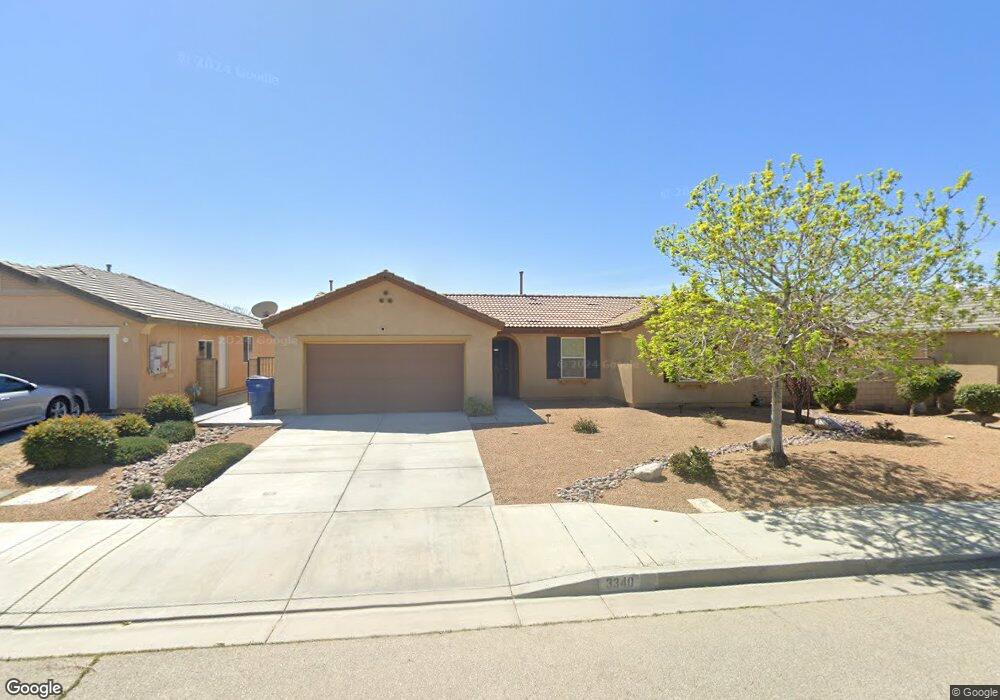
3340 James Ct Lancaster, CA 93535
East Lancaster NeighborhoodEstimated Value: $391,844 - $448,000
3
Beds
2
Baths
1,221
Sq Ft
$353/Sq Ft
Est. Value
About This Home
This home is located at 3340 James Ct, Lancaster, CA 93535 and is currently estimated at $431,211, approximately $353 per square foot. 3340 James Ct is a home located in Los Angeles County with nearby schools including Eastside Elementary School, Gifford C. Cole Middle School, and Eastside High School.
Ownership History
Date
Name
Owned For
Owner Type
Purchase Details
Closed on
Aug 26, 2021
Sold by
Jones Jennifer M and Jones Rayford Alonzo
Bought by
Jones Rayford Alonzo and Jones Jennifer
Current Estimated Value
Home Financials for this Owner
Home Financials are based on the most recent Mortgage that was taken out on this home.
Original Mortgage
$250,700
Interest Rate
3.45%
Mortgage Type
VA
Purchase Details
Closed on
Jun 21, 2013
Sold by
Jones Rayford Alonzo
Bought by
Jones Rayford Alonzo and Jones Jennifer M
Home Financials for this Owner
Home Financials are based on the most recent Mortgage that was taken out on this home.
Original Mortgage
$151,408
Interest Rate
4.36%
Mortgage Type
VA
Purchase Details
Closed on
Sep 2, 2009
Sold by
Kb Home Greater Los Angeles Inc
Bought by
Jones Rayford Alonzo
Home Financials for this Owner
Home Financials are based on the most recent Mortgage that was taken out on this home.
Original Mortgage
$153,735
Interest Rate
5.25%
Mortgage Type
VA
Create a Home Valuation Report for This Property
The Home Valuation Report is an in-depth analysis detailing your home's value as well as a comparison with similar homes in the area
Home Values in the Area
Average Home Value in this Area
Purchase History
| Date | Buyer | Sale Price | Title Company |
|---|---|---|---|
| Jones Rayford Alonzo | -- | Title365 | |
| Jones Rayford Alonzo | -- | Service Link | |
| Jones Rayford Alonzo | $151,000 | First American Title Ins Co |
Source: Public Records
Mortgage History
| Date | Status | Borrower | Loan Amount |
|---|---|---|---|
| Previous Owner | Jones Rayford Alonzo | $250,700 | |
| Previous Owner | Jones Rayford Alonzo | $151,408 | |
| Previous Owner | Jones Rayford Alonzo | $153,735 |
Source: Public Records
Tax History Compared to Growth
Tax History
| Year | Tax Paid | Tax Assessment Tax Assessment Total Assessment is a certain percentage of the fair market value that is determined by local assessors to be the total taxable value of land and additions on the property. | Land | Improvement |
|---|---|---|---|---|
| 2025 | $2,687 | $194,379 | $48,526 | $145,853 |
| 2024 | $2,687 | $190,569 | $47,575 | $142,994 |
| 2023 | $4,560 | $186,834 | $46,643 | $140,191 |
| 2022 | $4,415 | $183,172 | $45,729 | $137,443 |
| 2021 | $4,047 | $179,582 | $44,833 | $134,749 |
| 2019 | $3,980 | $174,257 | $43,504 | $130,753 |
| 2018 | $3,824 | $170,841 | $42,651 | $128,190 |
| 2016 | $3,617 | $164,209 | $40,996 | $123,213 |
| 2015 | $3,578 | $161,744 | $40,381 | $121,363 |
| 2014 | $3,219 | $128,100 | $32,000 | $96,100 |
Source: Public Records
Map
Nearby Homes
- 3345 James Ct
- 3360 James Ct
- 43150 Darby St
- 3150 James Ct
- 3213 Patti Ln
- 3309 Kaylyn St
- 43330 33rd St E
- 43048 Rucker St
- 10 38th St E
- 3030 Holline Ct
- 21000 E Avenue K 8
- 3009 Kaylyn St
- 0 Vac Avenue L and 30th St E Drt Vic Unit 25007121
- 3320 Kipper Ct
- Vl Apn 3170-007-020
- 43516 32nd St E
- 3116 Kilt Ct
- 0 Cor Avenue K 35th Ste Unit 25001141
- 0
- 2842 El Sol Dr
- 3346 James Ct
- 3332 James Ct
- 3352 James Ct
- 3326 James Ct
- 3331 James Ct
- 3351 James Ct
- 3320 James Ct
- 3325 James Ct
- 3312 James Ct
- 3319 James Ct
- 43045 Homestead Ct
- 3366 James Ct
- 43036 Homestead Ct
- 43053 Fleetwood Dr
- 43051 Homestead St
- 3311 James Ct
- 43051 Homestead Ct
- 3306 James Ct
- 43054 Fleetwood Dr
- 3305 James Ct