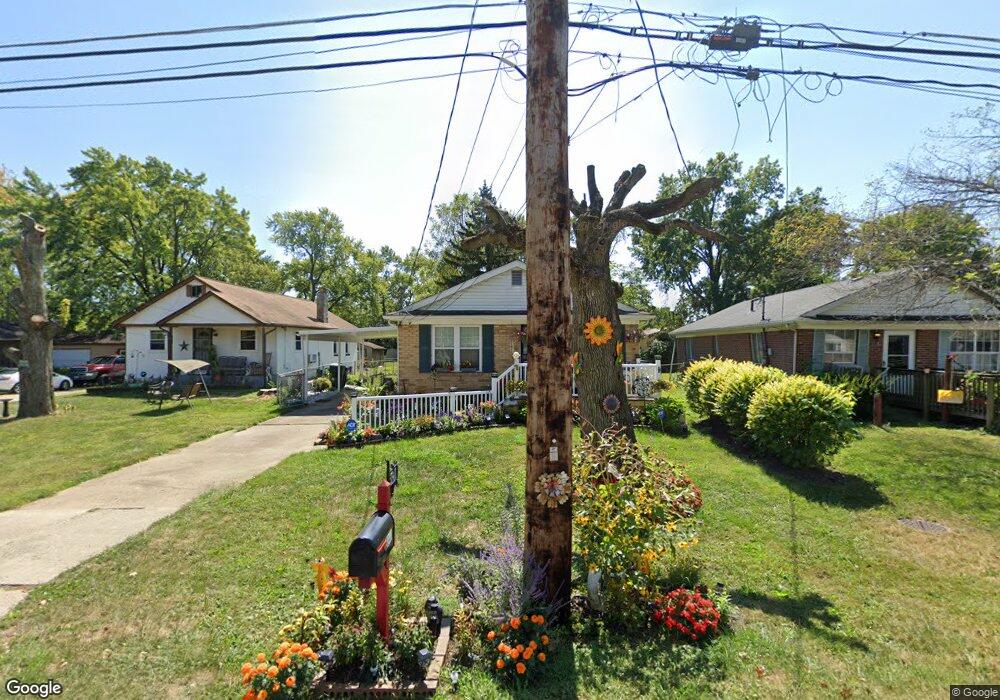
3341 E Deshler Ave Columbus, OH 43227
Linwood NeighborhoodEstimated Value: $135,000 - $216,000
3
Beds
1
Bath
912
Sq Ft
$196/Sq Ft
Est. Value
About This Home
This home is located at 3341 E Deshler Ave, Columbus, OH 43227 and is currently estimated at $178,439, approximately $195 per square foot. 3341 E Deshler Ave is a home located in Franklin County with nearby schools including Scottwood Elementary School, Johnson Park Middle School, and Walnut Ridge High School.
Ownership History
Date
Name
Owned For
Owner Type
Purchase Details
Closed on
Mar 24, 1998
Sold by
Stewart Bessie F
Bought by
Stewart Ruby J
Current Estimated Value
Purchase Details
Closed on
Oct 28, 1996
Sold by
Stewart Ruby J
Bought by
Stewart Ruby J and Stewart Bessie F
Purchase Details
Closed on
May 10, 1995
Sold by
Penrod Michael E
Bought by
Ruby J Stewart
Home Financials for this Owner
Home Financials are based on the most recent Mortgage that was taken out on this home.
Original Mortgage
$41,600
Interest Rate
8.88%
Mortgage Type
New Conventional
Create a Home Valuation Report for This Property
The Home Valuation Report is an in-depth analysis detailing your home's value as well as a comparison with similar homes in the area
Home Values in the Area
Average Home Value in this Area
Purchase History
| Date | Buyer | Sale Price | Title Company |
|---|---|---|---|
| Stewart Ruby J | $25,300 | -- | |
| Stewart Ruby J | $25,250 | -- | |
| Ruby J Stewart | $52,000 | -- |
Source: Public Records
Mortgage History
| Date | Status | Borrower | Loan Amount |
|---|---|---|---|
| Previous Owner | Ruby J Stewart | $41,600 |
Source: Public Records
Tax History
| Year | Tax Paid | Tax Assessment Tax Assessment Total Assessment is a certain percentage of the fair market value that is determined by local assessors to be the total taxable value of land and additions on the property. | Land | Improvement |
|---|---|---|---|---|
| 2025 | $2,126 | $47,360 | $14,600 | $32,760 |
| 2024 | $2,126 | $47,360 | $14,600 | $32,760 |
| 2023 | $2,098 | $47,355 | $14,595 | $32,760 |
| 2022 | $1,334 | $25,730 | $7,740 | $17,990 |
| 2021 | $1,337 | $25,730 | $7,740 | $17,990 |
| 2020 | $1,339 | $25,730 | $7,740 | $17,990 |
| 2019 | $1,285 | $21,180 | $6,440 | $14,740 |
| 2018 | $1,289 | $20,550 | $6,440 | $14,110 |
| 2017 | $1,358 | $20,550 | $6,440 | $14,110 |
| 2016 | $1,470 | $22,190 | $4,550 | $17,640 |
| 2015 | $1,334 | $22,190 | $4,550 | $17,640 |
| 2014 | $1,338 | $22,190 | $4,550 | $17,640 |
| 2013 | $733 | $24,640 | $5,040 | $19,600 |
Source: Public Records
Map
Nearby Homes
- 3325 E Deshler Ave
- 3428 LIV Moor Dr
- 3285 Scottwood Rd
- 1836 Penfield Ct S
- 3064 Niagara Ct E
- 1679 Penfield Rd
- 1353 Barnett Rd
- 1619 Basil Dr
- 1637 S James Rd
- 3622 Cushing Dr Unit C
- 3777 E Deshler Ave
- 2840 Manola Dr
- 3038 Wadsworth Ct
- 3036 Wadsworth Ct
- 1677 Kenview Rd
- 1455 Wilmore Dr
- 1341 Millerdale Rd
- 2251 Meridian Ct
- 2942 Arrowhead Ct
- 0 Rotunda Dr Unit 271
- 3337 E Deshler Ave
- 3353 E Deshler Ave
- 3333 E Deshler Ave
- 3355 E Deshler Ave
- 3329 E Deshler Ave
- 3363 E Deshler Ave
- 3376 Binbrook Rd N
- 1761 Binbrook Rd
- 3382 Binbrook Rd N
- 3379 E Deshler Ave
- 3328 E Deshler Ave
- 3388 Binbrook Rd N
- 1765 Binbrook Rd
- 1680 Coburg Rd
- 3387 E Deshler Ave
- 3394 Binbrook Rd N
- 1679 Coburg Rd
- 1672 Coburg Rd
- 3390 E Deshler Ave
- 1771 Binbrook Rd
Your Personal Tour Guide
Ask me questions while you tour the home.